Quality Standards
Alkaline Phosphatase (ALP) Goals
Continuing in our series of analytical goal comparisons, we evaluate the quality requirements and performance of alkaline phosphatase (ALP).
Alkaline Phosphatase (ALP) Quality: What's the right Goal? What's the actual performance?
Sten Westgard
APRIL 2014
In 2013, we took a look at a number of chemistry analytes, like chloride, calcium, sodium, potassium, and albumin and total protein to make assessments of which goals were achievable, and which methods were performing well. This month we're turning to a different analyte: Alkaline Phosphatase (ALP).
What's the Right Goal for ALP?
On a more specific level, even for laboratories that are attempting to assess and assure quality, the question of goals, targets and requirements are a challenge. The main question for labs is, "What is the Right Goal for this Test?" While the 1999 Stockholm hierarchy identifies an approach, the ideal quality goals - goals developed based on the evidence of how the test results are actually used by clinicians - are rare indeed. Even for well-studied assays that have been used in medicine for decades, there is still a wide disparity on the actual goal that should be used for quality.
| Analyte | Acceptance criteria / quality requirements | ||||
| CLIA | Desirable Biologic Goal |
RCPA | Rilibak |
Spanish |
|
| ALP | ± 30% | ± 11.7% | ± 15 U/L ≤ 125 U/L; ± 12% > 125 U/L; |
± 21.0% | ± 31% |
This is an analyte where the differences are stark and several of the guidelines share the same goal. The CLIA goal is essentially the same as the Spanish Minimum Consensus (30-31%), while the Desirable Biologic "Ricos Goal" and the RCPA goal are almost identical (11.7 - 12%). The Rilibak goal is somewhere in the middle between those two other goals.
Where can we find data on method performance?
Here is our standard caveat for data comparisons: it's really hard to get a good cross-instrument comparison study. While every lab has data on their own performance, getting data about other instruments is tricky. If we want true apples-to-apples comparisons of performance, moreover, we need to find a study that evaluates different instruments within the same laboratory under similar conditions. Frankly, those studies are few and far between. Not many labs have the time or the space to conduct head-to-head studies of different methods and analyzers. I've seen a lot of studies, but few gold-standard comparisons.
Proficiency Testing surveys and External Quality Assessment Schemes can provide us with a broad view, but the data from those reports is pooled together. Thus, we don't get individual laboratory standard deviations, we get instead the all-group SD or perhaps the method-specific group SD. As individual laboratory SDs are usually smaller than group SDs, the utility of PT and EQA reports is limited. If we want a better idea of what an individual laboratory will achieve with a particular method, it would be good to work with data from studies of individual laboratories.
In the imperfect world we live in, we are more likely to find individual studies of instrument and method performance. A lab that evaluates one instrument and its methods, compares it to a "local reference method" (i.e. usually the instrument it's going to replace). While we can get Sigma-metrics out of such studies, their comparability is not quite as solid. It's more of a "green-apple-to-red-apple" comparison.
Given those limitations, here are a few studies of major analyzer performance that we've been able to find in recent years:
- Evaluation des performances analytiques du systeme Unicel DXC 600 (Beckman Coulter) et etude de la transferabilite des resultats avec l’Integra 800 (Roche diagnostics), A. Servonnet, H. Thefenne, A. Boukhira, P. Vest, C. Renard. Ann Biol Clin 2007: 65(5): 555-62
- Validation of methods performance for routine biochemistry analytes at Cobas 6000 series module c501, Vesna Supak Smolcic, Lidija Bilic-Zulle, elizabeta Fisic, Biochemia Medica 2011;21(2):182-190
- Analytical performance evaluation of the Cobas 6000 analyzer – special emphasis on trueness verification. Adriaan J. van Gammeren, Nelley van Gool, Monique JM de Groot, Christa M Cobbeart. Clin Chem Lab Med 2008;46(6):863-871.
- Analytical Performance Specifications: Relating Laboratory Performance to Quality Required for Intended Clinical Use. [cobas 8000 example evaluated] Daniel A. Dalenberg, Patricia G. Schryver, George G Klee. Clin Lab Med 33 (2013) 55-73.
- The importance of having a flexible scope ISO 15189 accreditation and quality specifications based on biological variation – the case of validation of the biochemistry analyzer Dimension Vista, Pilar Fernandez-Calle, Sandra Pelaz, Paloma Oliver, Maria Josa Alcaide, Ruben Gomez-Rioja, Antonion Buno, Jose Manuel Iturzaeta, Biochemia Medica 2013;23(1):83-9.
- External Evaluation of the Dimension Vista 1500 Intelligent Lab System, Arnaud Bruneel, Monique Dehoux, Anne Barnier, Anne Bouten, Journal of Clinical Laboratory Analysis 2012;23:384-397.
- Evaluation of the Vitros 5600 Integrated System in a Medical Laboratory, Baum H, Bauer I, Hartmann C et al, poster PDF provided at Ortho-Clinical Diagnostics website. Accessed December 10th, 2013.
- Analytical evaluation of the clinical chemistry analyzer Olympus AU2700 plus, Jasna Juricek, Lovorka Derek, Adriana Unic, Tihana Serdar, Domagoj Marijancevic, Marcela Zickovic, Zeljko Romic, Biomedica Medica 2010;20(3):334-40.
- Sigma metrics used to access analytical quality of clinical chemistry assays: importance of the allowable total error (TEa) target. Hens K, Berth M, Armbruster D, Westgard S. Clin Chem Lab Med 2014 (in press)
These studies in turn can give us multiple data points (for instance, CV for high and low controls) for some instruments and we can attempt to evaluate these instruments' ability to achieve different quality requirements.
Can any instrument hit the Desirable Biologic TEa Goal for ALP?
Here is a Method Decision Chart using the "Ricos Goal" of 11.7%.
[If you're not familiar with Method Decision Charts and Six Sigma, follow the links here to brush up on the subject.]
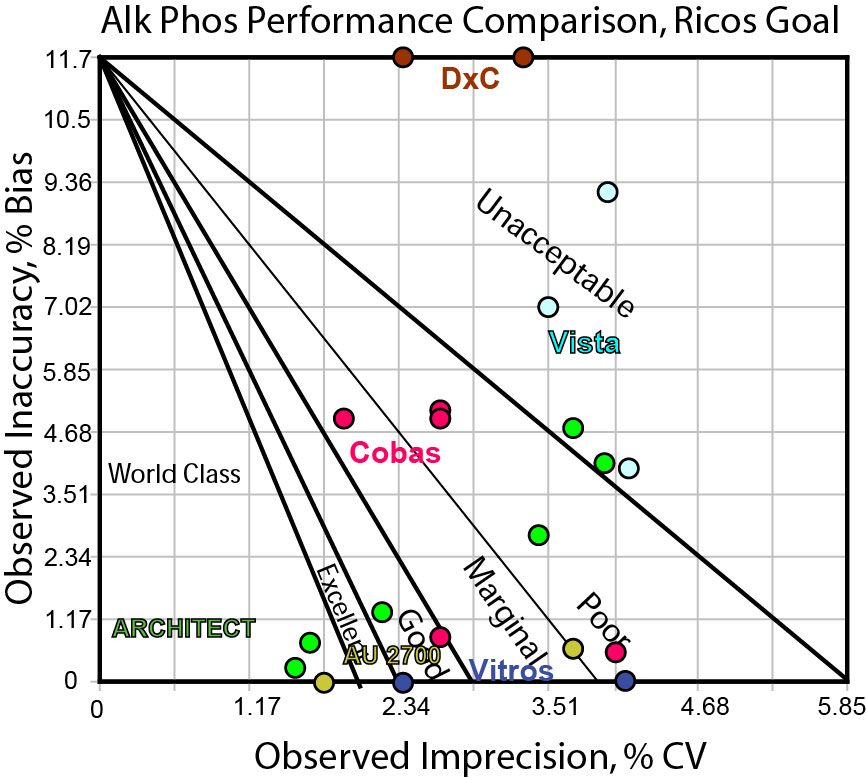
As you can see, this is a quality requirement that few methods can hit, and none can hit consistently. If we believe that the Ricos goal is the right goal, the market is not currently meeting that goal. Diagnostic manufacturers need to come out with another generation of instrumentation that has improved precision before this becomes a viable target.
Can any instrument hit the CLIA TEa goal for ALP?
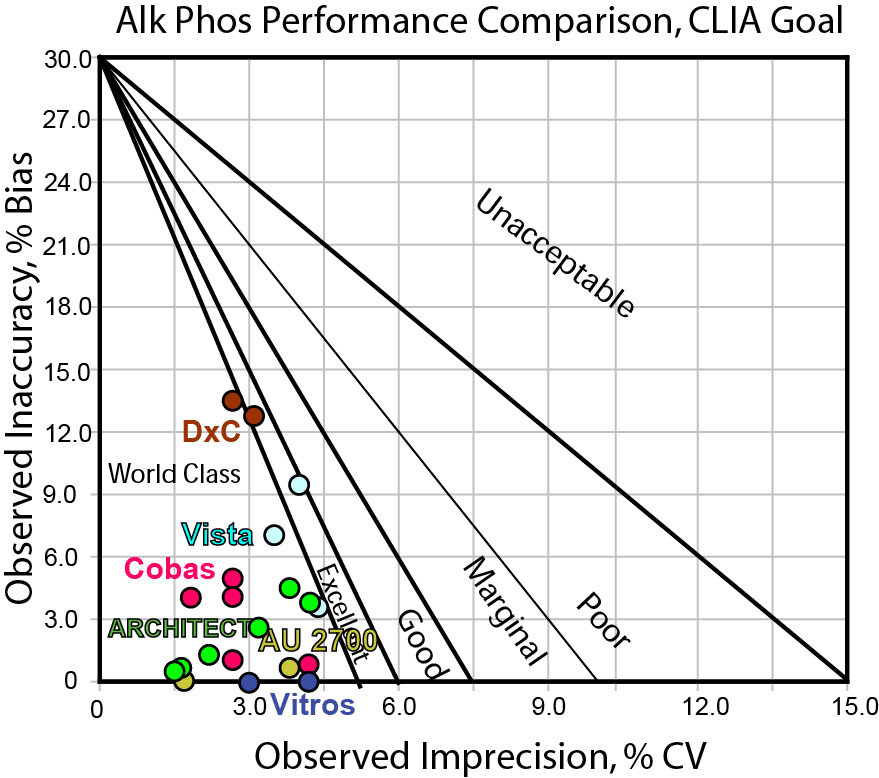
Here we have the opposite scenario. Nearly every data point is in the bull's-eye. Every method can hit the CLIA goal. If the CLIA goal is appropriate, that means we can have confidence that any instrument on the market is able to achieve a high level of quality for this test.
Can any instrument hit the Rilibak interlaboratory comparison goal for ALP?
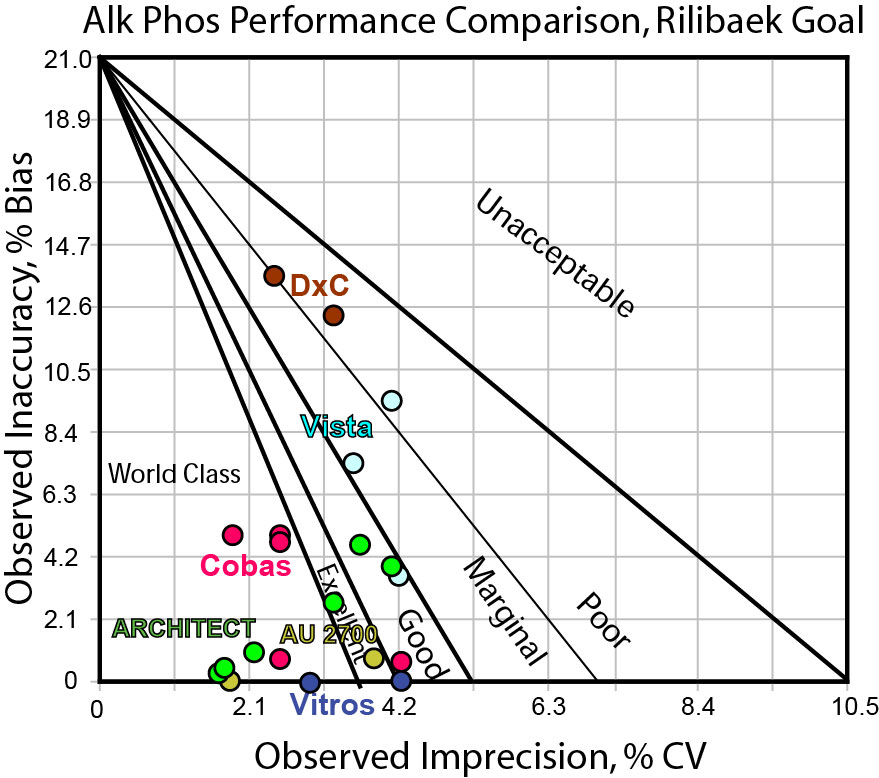
With the Rilibak goal mid-way between the CLIA and Ricos goal, we should not be surprised that this provides the most differentiation of performance. Using a target of 21%, we can see that some instruments are consistently in the bull's-eye (Cobas), some can hit the bull's-eye some of the time (Vitros, ARCHITECT, Olympus), but there are still some methods that are missing the center of the target (DxC, Vista). In practical terms, this goal helps us narrow down our options.
Conclusion
With quality requirements, there is no one source that is completely perfect and practical. Laboratories need to be careful when selecting quality goals, making sure that they choose the goals that they are mandated to meet (In the US, labs must be able to achieve CLIA targets), but also making sure that their goals are practical and in harmony with the actual clinical use of the test in their health system.
It appears here that the three goals have three different stories to tell: 1. no one can hit the bull's-eye; 2. everyone can hit the bull's-eye; and 3. some methods are in the bull's-eye, but some are not.
For ALP, instrument performance seems to have improved beyond the original CLIA goal of 30%, and it may be more appropriate to tighten that quality requirement. While there is a common belief that many CLIA targets are too wide, our studies thus far have shown that many instruments are still not capable of achieving world class quality using those CLIA targets. But in this case, it may be true.
Remember, from our perspective, a goal that no one (no method) can hit is not useful, except perhaps to instrument researchers and design engineers (for them, this becomes an aspirational target, to design the next generation of methods to achieve that ultimate level of performance). Neither is it helpful to use a goal that every method can hit - that might only indicate we have lowered the bar too much, and actual clinical use could be tightened and improved to work on a finer scale. It appears that many of the manufacturers have world class methods (although a few are not doing well). So the use of a 30% goal can give a lot of good news, but in terms of differentiating performance of manufacturers, the goal 21% is more discriminating and can separate the wheat from the chaff. Laboratories should confirm that the choice of any of these goals matches with the clinical expectations and use of the test results.
If you liked this article, you might also like
- What's the Right Goal?
- What's the Right Goal? An Example
- The Stockholm Consensus Hierarchy
- Can any method hit the Sodium target?
- Can any method hit the Potassium target?
- Can any method hit the Albumin target?
- Can any method hit the Chloride target?
- Can any method hit the Total Protein target?
- Can any method hit the ALT target?
- Can any method hit the AST target?
- Can any method hit the Glucose target?