Sigma Metric Analysis
Sigma-metrics of a Mindray BC-3600 hematology analyzer
Completing our trilogy of Mindray hematology instruments, we go back to a 2013 study of the BC-3600. The study authors concluded this instrument's performance is "satisfactory." Does a Sigma-metric analysis agree?
Sigma-metrics of Mindray BC-3600 automated hematology analyzer
- The Precision and Comparison data
- Determine quality requirements at the critical decision level
- Calculate Sigma metrics
- Summary of Performance by Sigma-metrics chart and OPSpecs Chart
- Conclusion
March 2016
Sten Westgard, MS
 |
[Note: This QC application is an extension of the lesson From Method Validation to Six Sigma: Translating Method Performance Claims into Sigma Metrics. This article assumes that you have read that lesson first, and that you are also familiar with the concepts of QC Design, Method Validation, and Six Sigma. If you aren't, follow the link provided.] |  |
In previous articles, we've analyzer the Mindray BC-5000 and the BC-6800. This analysis looks at an analyzer at a smaller model, the BC-3600:
Evaluation of Mindray BC-3600 hematology analyzer in a university hospital Shu G, Lu H, Du H, Shi J, Wu G, Int Jnl Lab Hem 2012;35:61-69.
The Imprecision and Bias Data
For imprecision, "Between-days precision were calculated by processing the manufacturer's control material with low, normal, and high twice a day over a period of 20 days (total n=40)."
For bias, "One-hundred samples including 50 normal samples and 50 abnormal samples were performed twice on BC-3600, BC-3200 and XE-2100 Analyzer." The calculations for comparison were performed following CLSI EP9-A2 guidelines.
We're only going to select five analytes here for Sigma-metric analysis: WBC, Lymphocytes, RBC, Hemoglobin, and Platelets.
| Assay | Level |
CV% | slope | y-intercept | Bias% |
| WBC | 1.85 | 2.99% | 1.0084 | -0.042 | |
| 7.71 | 1.7% | ||||
| 20 | 1.16% | ||||
| Lymphocytes | 58.5 | 2.73% | 0.9081 | 2.8504 | |
| 29.8 | 1.91% | ||||
| 14.2 | 2.19% | ||||
| RBC | 2.5 | 1.34% | 0.9882 | 0.0554 | |
| 4.86 | 0.98% | ||||
| 5.81 | 0.91% | ||||
| Hemoglobin | 59.8 | 1.93% | 1.0388 | -4.288 | |
| 133.5 | 1.21% | ||||
| 180.5 | 1.24% | ||||
| Platelets | 73.3 | 4.94% | 1.0297 | -8.39 | |
| 238.1 | 1.74% | ||||
| 476.4 | 1.85% |
Notice, we haven't calculated the bias yet. Since we have three levels of imprecision, we can calculate bias at each of those levels.
The study determined the correlation coefficient, slope and y-intercept. The regression equation can be used to determine the difference between the Mindray and a Sysmex XE 2100.
Newlevel = (slope * Oldlevel ) + Y-intercept
As an example, let's take WBC, where the study determined a slope of 1.0084 and y-intercept of -0.042.
Newlevel1 = (1.0084 * 1.85 ) - 0.042
Newlevel1 = (1.8655) -0.042
Newlevel1 = 1.8235
The bias between the old and new level is the absolute value of the difference between 1.85 - 1.8235 = 0.02646
This is an 1.4% bias at the level of 1.85.
Now we'll just fill in all the biases...
| Assay | Level |
CV% | slope | y-intercept | Bias% |
| WBC | 1.85 | 2.99% | 1.0084 | -0.042 | 1.4% |
| 7.71 | 1.7% | 0.3% | |||
| 20 | 1.16% | 0.6% | |||
| Lymphocytes | 58.5 | 2.73% | 0.9081 | 2.8504 | 4.3% |
| 29.8 | 1.91% | 0.4% | |||
| 14.2 | 2.19% | 10.9% | |||
| RBC | 2.5 | 1.34% | 0.9882 | 0.0554 | 1.0% |
| 4.86 | 0.98% | 0% | |||
| 5.81 | 0.91% | 0.2% | |||
| Hemoglobin | 59.8 | 1.93% | 1.0388 | -4.288 | 1.9% |
| 133.5 | 1.21% | 1.2% | |||
| 180.5 | 1.24% | 1.2% | |||
| Platelets | 73.3 | 4.94% | 1.0297 | -8.39 | 4.9% |
| 238.1 | 1.74% | 1.7% | |||
| 476.4 | 1.85% | 1.9% |
Determine Quality Requirements at the decision levels
Now that we have our imprecision and bias data, we're almost ready to calculate our Sigma-metrics. We're just missing one critical component: the analytical quality requirement. In this example, we're going to use several different sets of quality requirements to judge the method. We'll start just by using the "Ricos Goals" for imprecision and bias separately. Next, we'll use the CLIA proficiency testing criteria, which sets specifications for some hematology parameters. Where CLIA doesn't regulate an analyte (for example lymphocytes), we'll use the "Ricos goals."
Here's a comparative table of the different quality goals available:
| Assay | Ricos CV% |
Ricos Bias% | Ricos TEa% | CLIA TEa% | Spanish Minimum TEa% |
Rilibak TEa% |
| WBC | 5.73% | 6.05% | 15.44% | 15% | 9.0% | 12.0% |
| RBC | 1.6% | 1.7% | 4.4% | 6.0% | 4.0% | 8.0% |
| HGB | 1.43% | 1.84% | 4.19% | 7.0% | 5.0% | 6.0% |
| PLT | 4.6% | 5.9% | 13.4% | 25.0% | 16.0% | |
| Lymphocytes | 5.1% | 9.19% | 17.6% |
Judging on imprecision and bias separately, using the Ricos desirable maximum allowable specifications, we'll highlight in green where performance is acceptable, and highlight in red where performance is unacceptable
| Assay | Level |
Ricos Des. CV |
Ricos Des. Bias |
CV% | Bias% |
| WBC | 1.85 | 5.73 | 6.05 | 2.99% | 1.4% |
| 7.71 | 1.7% | 0.3% | |||
| 20 | 1.16% | 0.6% | |||
| Lymphocytes | 58.5 | 5.1 | 9.19 | 2.73% | 4.3% |
| 29.8 | 1.91% | 0.4% | |||
| 14.2 | 2.19% | 10.9% | |||
| RBC | 2.5 | 1.6 | 1.7 | 1.34% | 1.0% |
| 4.86 | 0.98% | 0% | |||
| 5.81 | 0.91% | 0.2% | |||
| Hemoglobin | 59.8 | 1.43 | 1.84 | 1.93% | 1.9% |
| 133.5 | 1.21% | 1.2% | |||
| 180.5 | 1.24% | 1.2% | |||
| Platelets | 73.3 | 4.6 | 5.9 | 4.94% | 4.9% |
| 238.1 | 1.74% | 1.7% | |||
| 476.4 | 1.85% | 1.9% |
There are a few problems here but not that many. The performance of these assays meets most of the desirable specifications set by the 2014 Ricos goals.
That's the simple comparison of two separate components. What about using Sigma-metrics and allowable total error? Would that deliver the same verdict, or a different one?
Calculate Sigma metrics
Sigma-metrics takes both imprecision and bias into account in a single equation. We're going to calculate Sigma-metrics using both "Ricos goals" and the CLIA goals.
Remember the equation for Sigma metric is (TEa - bias%) / CV.
Example calculation: for WBC, with a 15% quality requirement, given 2.99% imprecision and 1.4% bias:
(15 - 1.4) / 2.99 = 13.6 / 2.99 = 4.5 Sigma
Similar to the judgement we made earlier with separate components, this Sigma-metric verdict on this WBC assay is good.
So here's the table with all the Sigma-metrics using CLIA Goals:
| Assay | Level |
CV% | Bias% | Sigma- metric |
| WBC | 1.85 | 2.99% | 1.4% | 4.5 |
| 7.71 | 1.7% | 0.3% | >6 | |
| 20 | 1.16% | 0.6% | >6 | |
| Lymphocytes | 58.5 | 2.73% | 4.3% | 4.9 |
| 29.8 | 1.91% | 0.4% | >6 | |
| 14.2 | 2.19% | 10.9% | 3.1 | |
| RBC | 2.5 | 1.34% | 1.0% | 3.7 |
| 4.86 | 0.98% | 0% | >6 | |
| 5.81 | 0.91% | 0.2% | >6 | |
| Hemoglobin | 59.8 | 1.93% | 1.9% | 1.9 |
| 133.5 | 1.21% | 1.2% | 5.2 | |
| 180.5 | 1.24% | 1.2% | 4.4 | |
| Platelets | 73.3 | 4.94% | 4.9% | 3.3 |
| 238.1 | 1.74% | 1.7% | >6 | |
| 476.4 | 1.85% | 1.9% | >6 |
Overall, there are a lot of good metrics here.
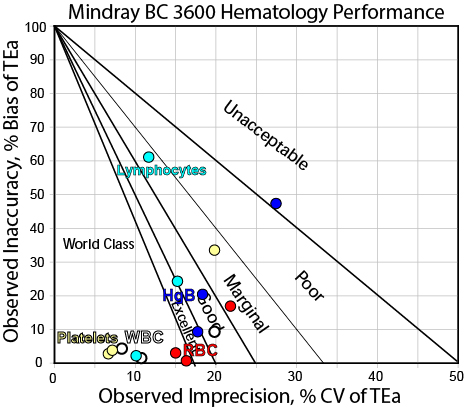
Summary of Performance by Sigma-metrics Method Decision Chart and OPSpecs chart
We can make visual assessments of this performance using a Normalized Sigma-metric Method Decision Chart. First we'll look at the CLIA Goals MEDx chart:
Now what about QC? How do we monitor and control these methods? For that, we need a Normalized OPSpecs chart:
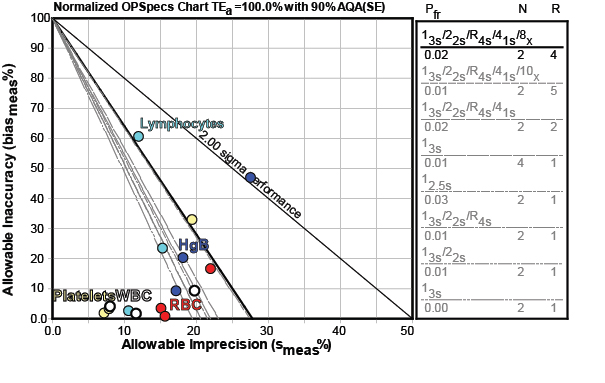
Most of the methods are easily controllable with 3 controls and 3s control limits. A few of the points are a bit far away from the bull's eye, but possibly the level at which those metrics were measured are not as critical. Here's where we would need to think more about the clinical use of the tests. It may be useful for the laboratory to determine which one of those three levels is the most important. If the low level lymphocytes are not as important as the mid and high level, then we could ignore that one point and only optimize the QC design around the other two levels.
Conclusion
The authors concluded "the BC-3200 Auto Hematology Analyzer performed well for the parameters evaluated....Further, there was a good correlation between the evaluated instruments and the reference analyzer, the BC-3200 and the Sysmex XE-2100 Analyzer."
Based on Sigma-metric analysis, we would agree.