Basic Method Validation
Calibration Verification Criteria for Acceptable Performance
CLIA and CAP require continuous calibration verification. Interestingly, the regulations aren't that specific about how to judge whether or not the calibration is successful.
Calibration Verification: Defining Criteria for Acceptable Performance
James O. Westgard, PhD
May 2016
Many years ago we published a manual, the CLIA Final Rules for Quality Systems [1], that included a chapter on “Calibration and Calibration Verification.” One of the issues at that time was how to establish limits for acceptable performance for calibration verification. Our answer:
Truth be told, the laboratory is free to do whatever it wants! However, it would be best that the laboratory director or clinical consultant sign-off on whatever limits are set. In general, laboratory quality management practices are not based on objective quality goals or performance criteria. But they could be!
We suggested that the CLIA criteria for acceptable performance in PT surveys provided one source of quality specifications that might be applied. Today we could apply other types of quality goals that have been defined for intended clinical use of laboratory tests, for example, bias criteria based on biologic variation.
CMS provides guidance on Calibration and Calibration Verification in a brochure that is available from the CMS website [2]. It provides the following definitions:
- Calibration is the process of testing and adjusting the instrument or test system readout to establish a correlation between the instrument’s measurement of the substance being tested and the actual concentration of the substance.
- Calibration verification means testing materials of known concentration in the same manner as patient specimens to assure the test system is accurately measuring samples throughout the reportable range.
Unfortunately, the brochure doesn’t address the issue of how to set criteria or limits for verifying performance is acceptable.
Laboratories continue to ask for advice on calibration verification, as well as reportable range. The two requirements are often intermixed (and confused) because the experimental procedures are similar, sometimes even identical. Reportable range is one of the first performance characteristics that should be evaluated in the initial validation of a method. Calibration verification is supposed to be a continuing performance check (at least every 6 months or whenever reagent lots are changed, major preventive maintenance is performed, or control problems persist after corrective actions) on the accuracy of calibration throughout the reportable range.
Samples to be tested: For calibration verification, the samples must have “assigned values” that represent the expected concentrations. These may be control solutions that have assigned values, proficiency testing samples that have assigned target values, or special series of “linearity” materials that have assigned values. For reportable range, the samples could have assigned values, but could also utilize “relative” values from a series of dilutions of a high standard or high patient sample, or mixtures of dilutions of a low and high patient sample pool.
Experimental procedure: CLIA requires a minimum of 3 levels (low, mid, and high) be analyzed. Many laboratories prefer 5 levels and that is a more standard practice today. Even more levels may be useful for measurands with a wide reportable range, for example, for glucose it would be useful to have levels of 0, 50, 100, 200, 300, 400, and 500 mg/dL. CMS advises that the samples should be analyzed like regular patient samples, which means going through the same steps of the analytic testing process as the patient sample. CLIA permits a single measurement on each of the materials. Unlike proficiency testing, that doesn’t restrict the analysis to single test results. We prefer replicates, at least duplicates and preferably triplicates. In the illustrative examples that follow, the measurement results represent the correct observed values.
Graphical data assessment: Plot the measurement results on the y-axis vs the assigned values on the x-axis. Draw a 45 degree line of identity, then draw a “point-to-point” line for the measurement results. Compare the two lines. If they don’t agree, how large are the differences between the values?
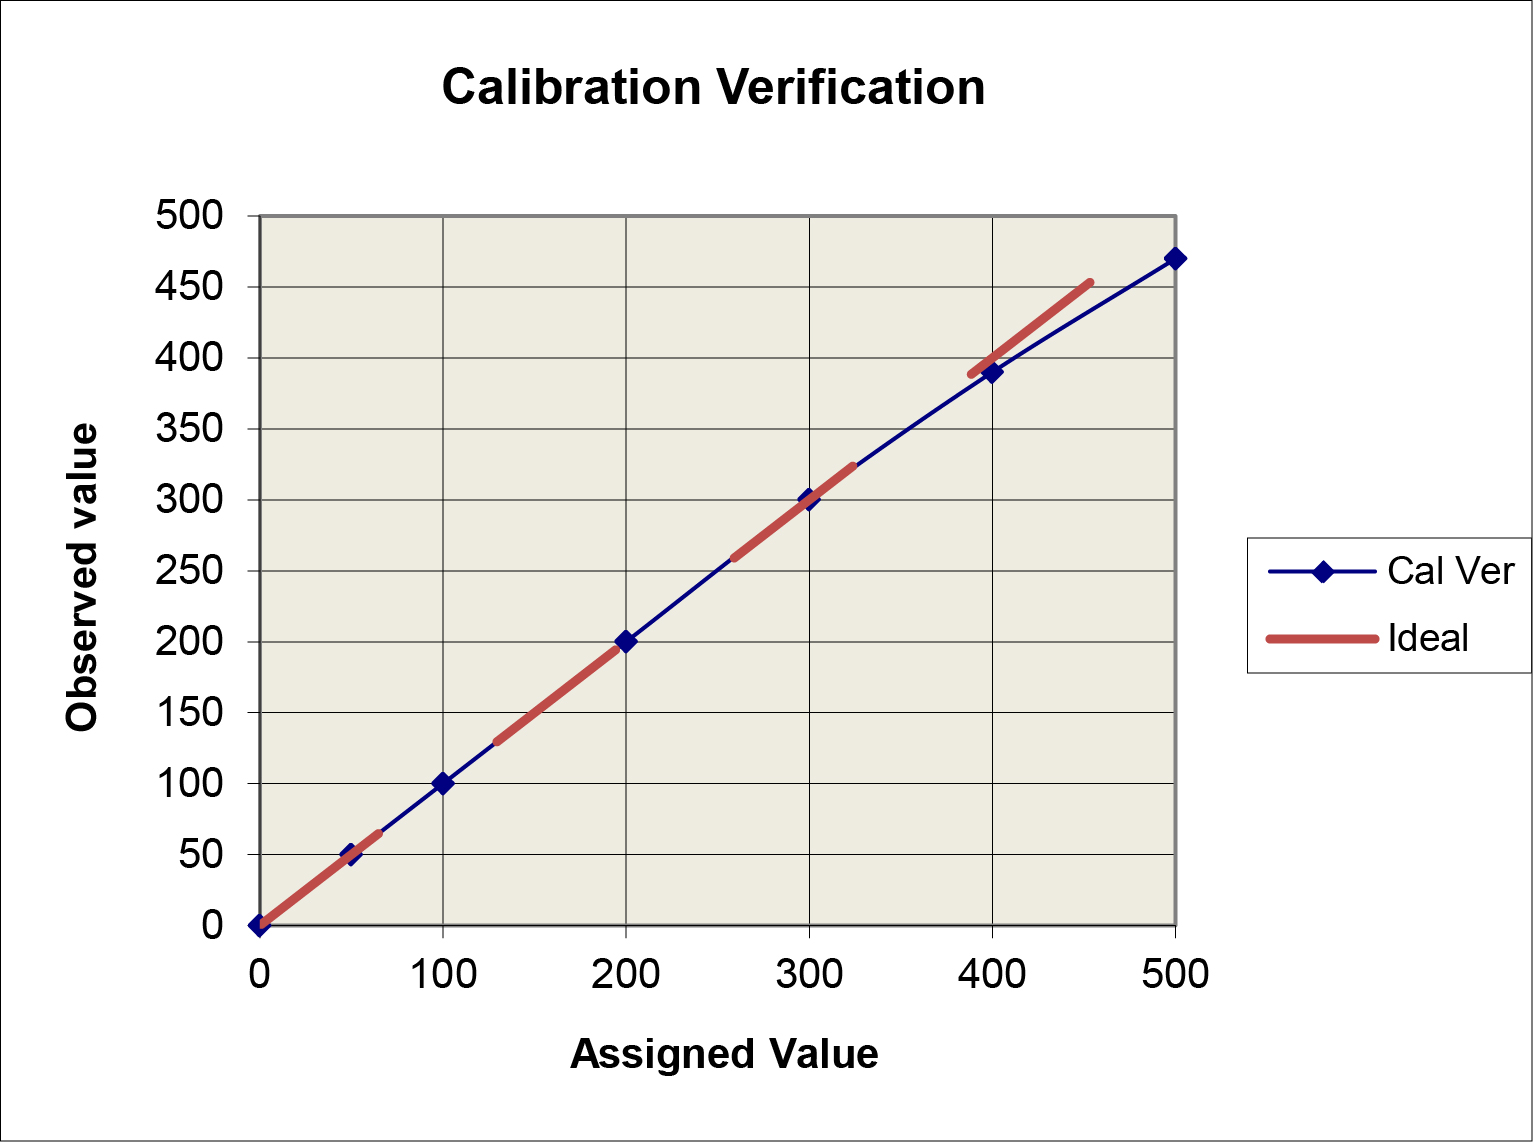
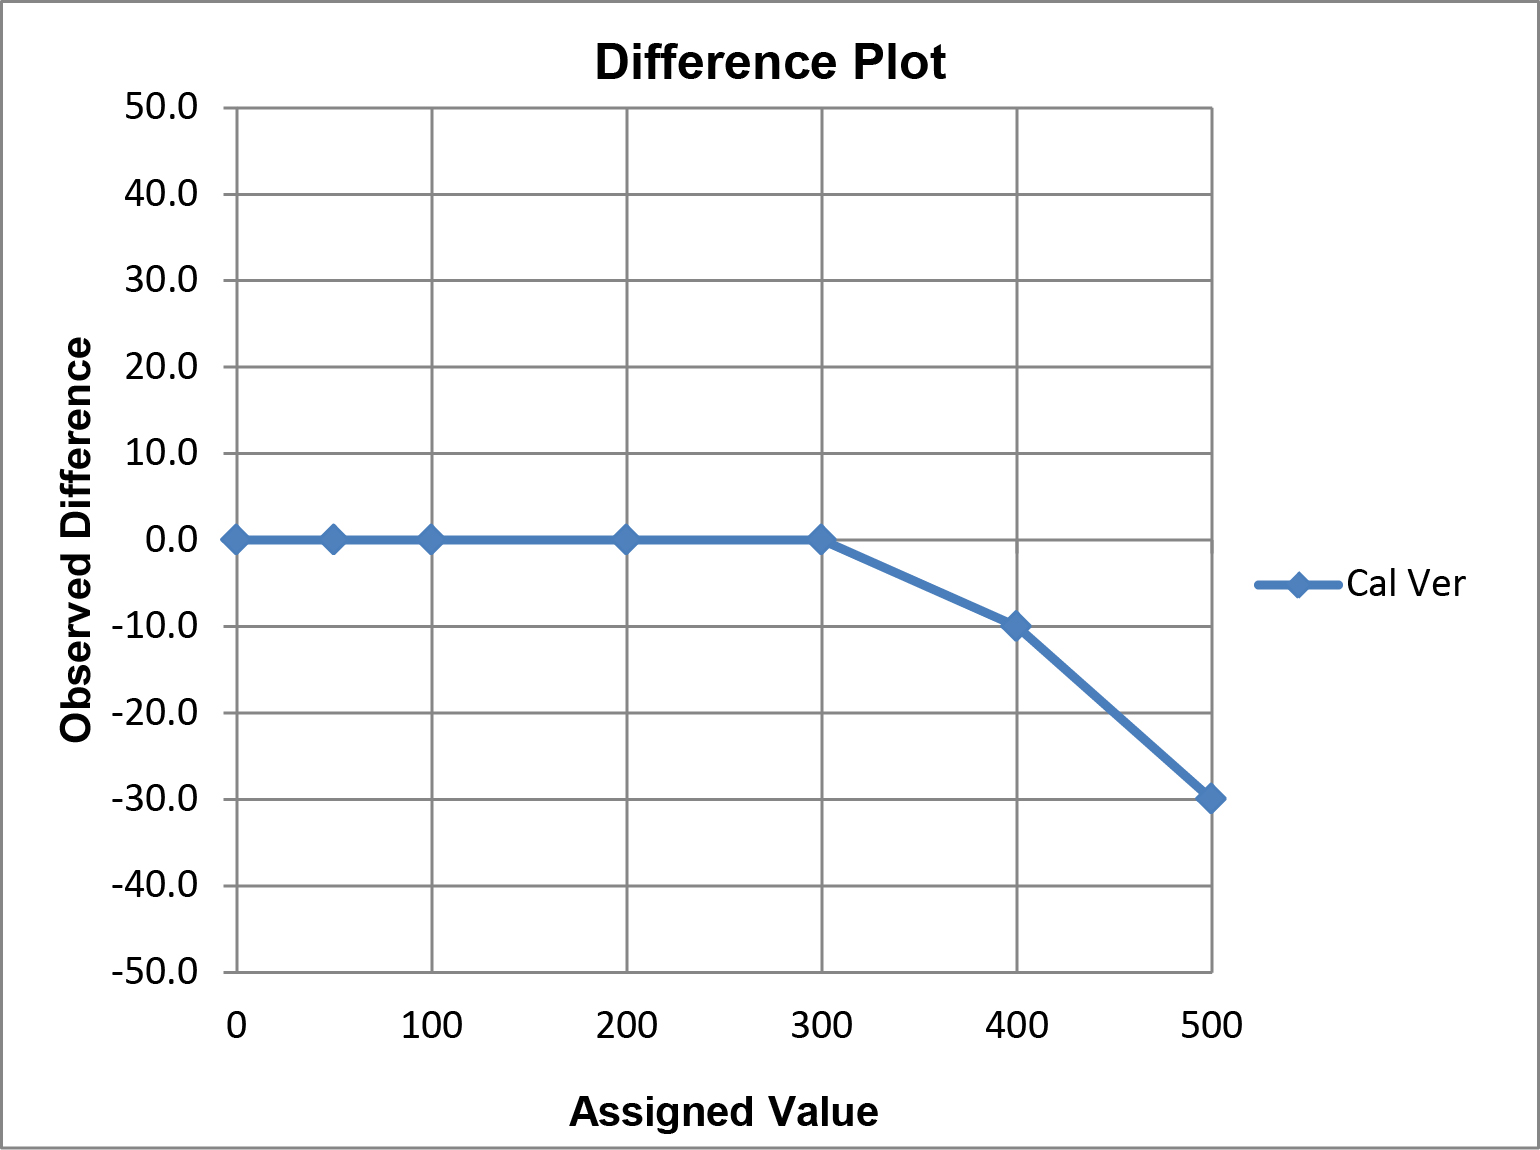
A limitation of this “comparison plot” is that the differences, or deviations from linearity, appear small compared to the range of values and may therefore seem insignificant. A better visual assessment of the agreement/disagreement between the observed and assigned values can be made by plotting the differences (observed value minus assigned value) on the y-axis vs the assigned values on the x-axis, which is commonly referred to as a “difference plot.”
Graphical criteria for acceptability: The CLIA criteria for acceptable performance can be applied in different ways.
(a) For singlet measurements on each level, calculate the upper and lower limits for each assigned value. For example, for 0 mg/dl, the limits are ± 6 mg/dL or -6 to +6 mg/dL; for 50 mg/dL ± 6 mg/dL (44 to 56); for 100 mg/dL ± 10%, or 90 to 110 mg/dL, for 200 mg/dL ± 10% or 180 to 220 mg/dL, etc.
(b) For replicate measurements on each level, plot the average value of the results vs the assigned value. Use of the average result will reduce the “scatter” or random error, therefore the deviations from the assigned value will be mainly attributable to the bias of the method and more specifically reflect the non-linearity of the method. As a rule of thumb, the allowable bias is often taken as 1/3 or 33% of TEa. The rationale is that TEa should cover |bias| + 2 SD, so 2/3 of TEa will be consumed by the imprecision or random error of the method. Use of the average result should minimize (hopefully eliminate) the contribution of random error, therefore the criterion for the remaining bias is 0.33*TEa.
(c) A more exact approach would be to account for the known SD of the method in the calculation of allowable limits for bias, rather than assume 2/3 of TEa is budgeted for random error.
Application of the ±TEa criteria (option a above) is illustrated in the following graph. The observed calibration verification line falls within the TEa criteria, thus the performance would be judged as acceptable.
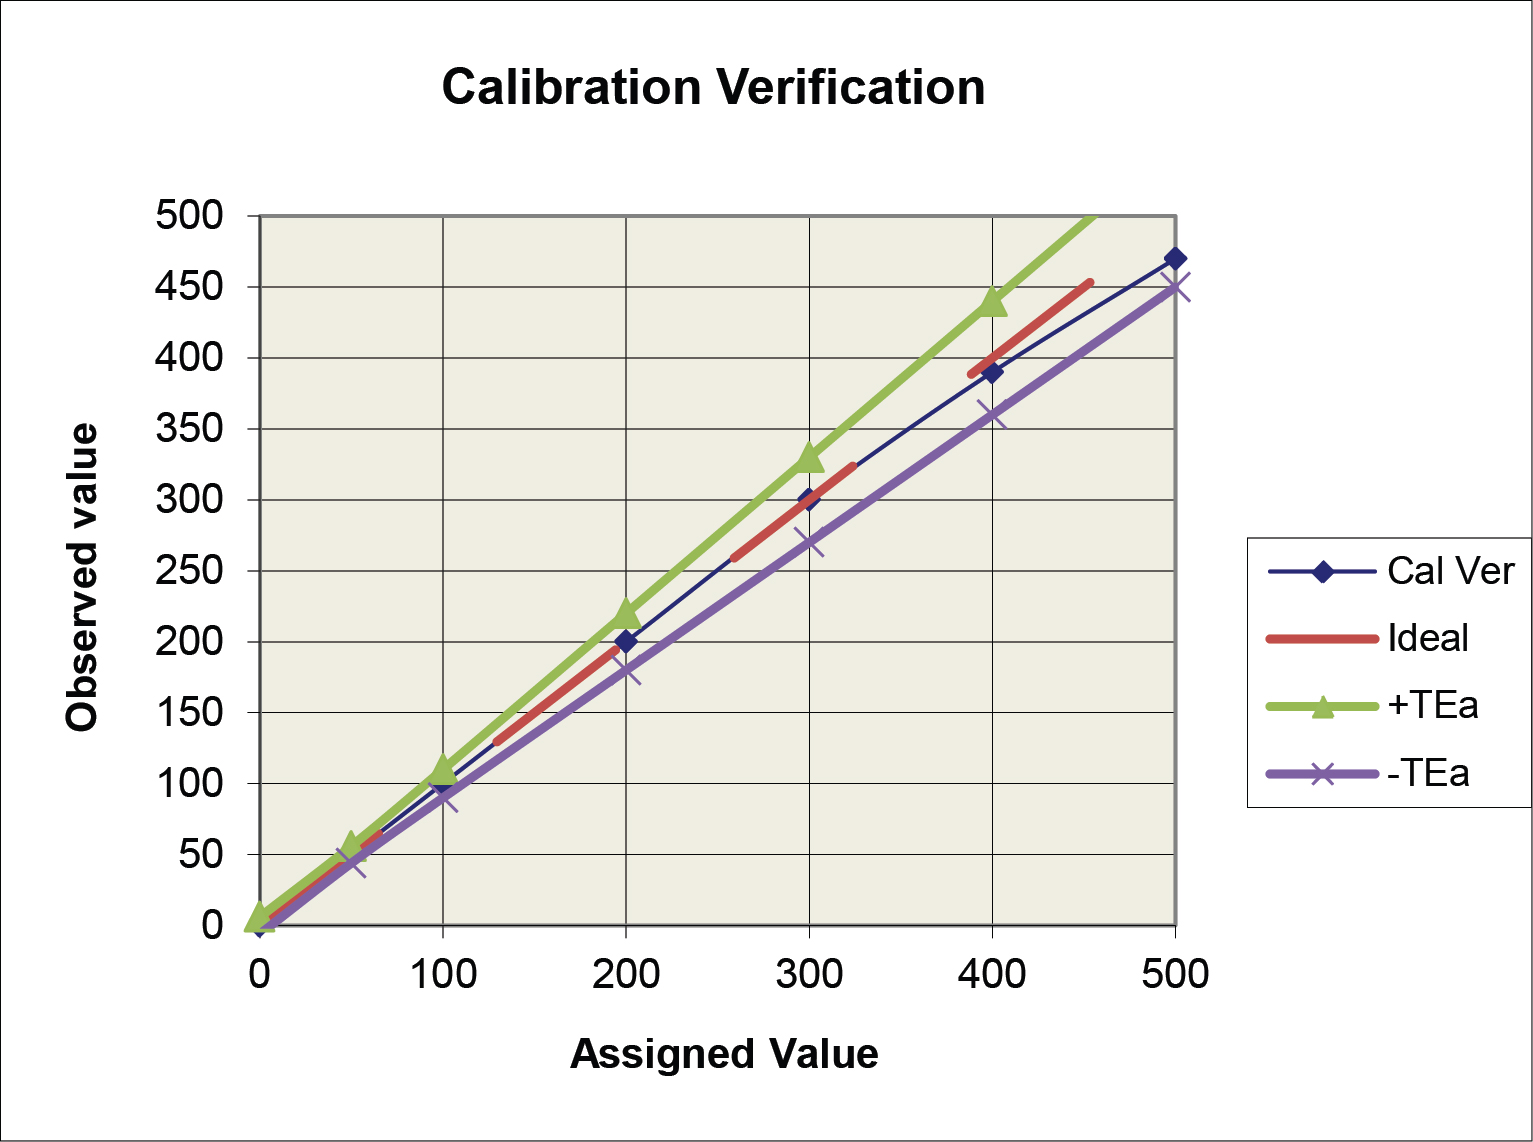
The option b criteria could also be applied to the plot above, but the graph would become “cluttered” and difficult to read, therefore it is easier to illustrate multiple criteria on the difference plot below.
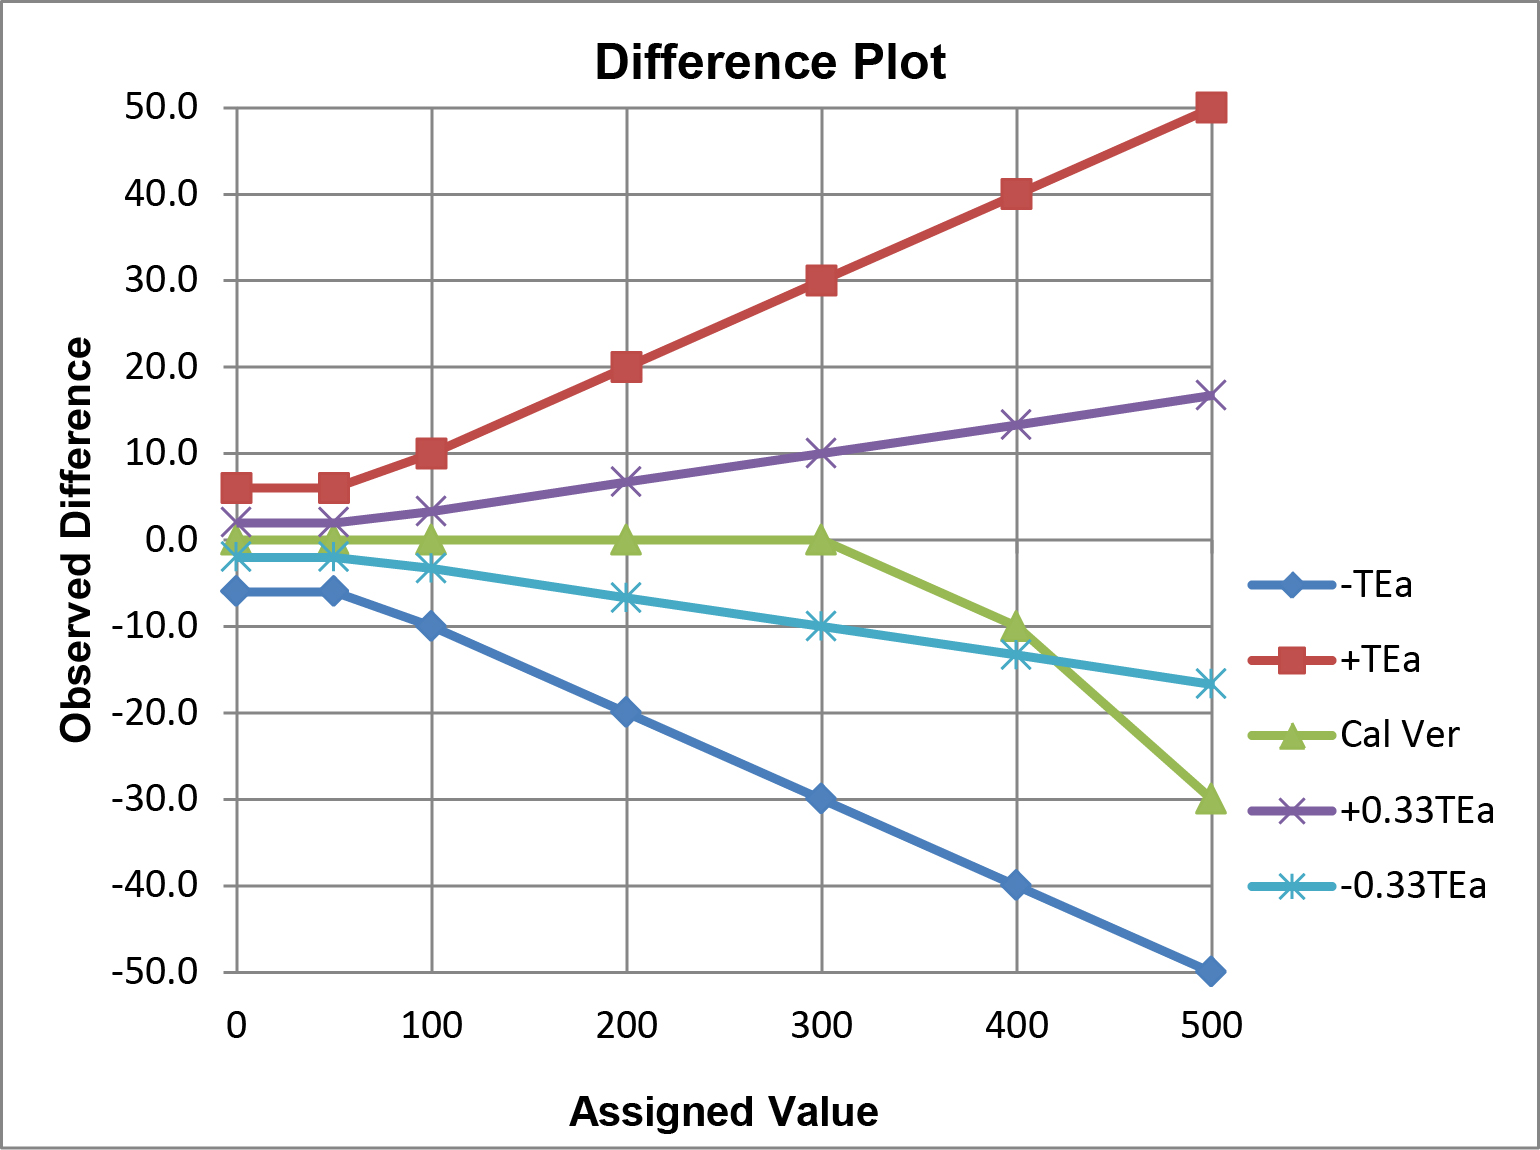
In this example, performance for calibration verification is acceptable for the option a ±TEa criteria, but not for the option b ±0.33 TEa criteria. Observe the crossover of the calibration verification results and the line that represents the allowable limit for -0.33 TEa.
Statistical criteria for acceptable performance: Linear regression statistics can be calculated and the slope compared to the ideal slope of 1.00. When TEa is defined as a percentage, the criteria for acceptable performance can be set as the ideal slope ± %TEa/100. For glucose, for example, acceptable performance would be indicated by a slope of 1.00 ± 10/100 or 0.90 to 1.10. When TEa is defined in concentration units, then the criteria for acceptable performance would be the ideal slope ± TEa/Xc, where Xc represents a critical medical decision concentration, or alternatively, the mean of the test samples included in the experiment. For example, for sodium, TEa is 4 mmol/L. Given the narrow reference interval, the mean patient value of 140 mmol/L could be used to set an acceptable slope of 1.00 ± 4/140 or 0.97 to 1.03.
The reliability of the calculated slope will depend on the number of levels, number of replicates, the range from the lowest level to highest level, the scatter or random error in the data, as well as the effects of systematic errors such as nonlinearity. The averages of replicates of 5 levels are much preferred to singlets of 3 levels. Tests with wide reportable ranges (e.g., glucose) can be better assessed than tests with narrow reportable ranges (e.g., sodium, calcium). A graphical assessment of the data is always necessary to identify possible outliers, problems with the range of data, as well as nonlinear behavior. All of these issues have been discussed in the context of comparison of methods experiment and are also of major concern in the statistical assessment of the results from the calibration verification experiment [3]. An important conclusion is that the correlation coefficient itself is of no use as a criterion for calibration verification because it is not affected by the presence of constant or proportional systematic errors and nonlinear behavior will also be masked when a wide analytic range is studied.
There are more sophisticated (and more complicated) statistical criteria, such as fitting the data to different order regression models (1st order linear, 2nd order quadratic) to assess whether linear or nonlinear models provide the best fit. It may also be useful to fit the data to a linear model, then sequentially restrict the data by eliminating the highest level to see the effect on the linear regression line.
What’s the point?
The first step in assessing the acceptability of calibration verification should always be the preparation of a comparison plot and a critical inspection of the data. Then focus on the differences between the observed and assigned values and compare them to a defined quality requirement that provides a limit for the amount of error that is acceptable for the clinical intended use of the test. Calculation of the exact differences will be helpful in making this assessment, as well as preparation of a difference plot to provide visual documentation. The laboratory Medical Director is ultimately responsible for defining the quality requirement and the limit for acceptable performance.
References
- Westgard JO, Ehrmeyer SS, Darcy TP. CLIA Final Rules for Quality Systems. Madison WI:Westgard QC, Inc. 2004.
- CMS/CLS Brochure #3. Calibration and Calibration Verification. https://www.cms.gov/Regulations-and-Guidance/Legislation/CLIA/Downloads/6065bk.pdf
- Westgard JO. Basic Method Validation. Chapter 12. Statistical sense, sensitivity, and significance. Madison WI:Westgard QC, Inc., 2008.