QC Design
Glycated Hemoglobin
In the March 2002 issue of Clin Chem, the NACB published a 36 page report about the use of laboratory tests for patients with diabetes. It's probably the longest paper ever published by Clin Chem. Dr. Westgard examined the "evidence-based" recommendations, though, and found some poor Sigma values. Here, using EZ Rules software, Dr. Westgard demonstrates the process of choosing QC for GHb.
Note: this page contains over a dozen graphics. Loading may take some time.
An example QC application (using EZ Rules software) is shown step-by-step below, using a clinical quality requirement and performance specifications recommended by the NACB. See the related essay about evidence-based medicine, QC, and specifications.
This glycated hemoglobin (GHb) example is based on the "evidence-based" guidelines and recommendations from the National Academy of Clinical Biochemistry as published in March 2002 [1]. This application follows the steps of our EZ Rules computer program.
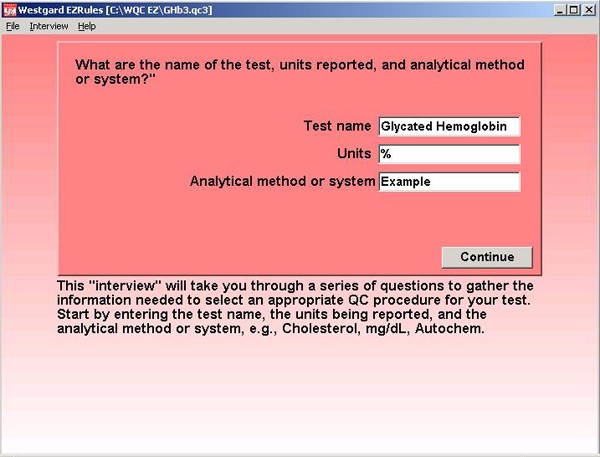
Step 1. After signing on to the EZ Rules program, a file has been created for the Glycated Hemglobin application and we begin to enter information about the test name, units, and analytical method or system.
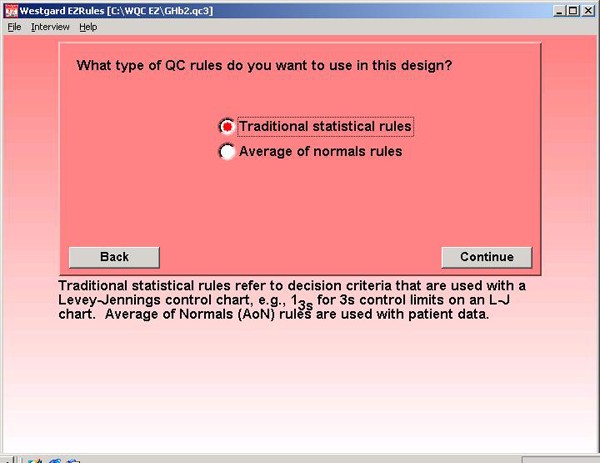
Step 2. Traditional statistical rules are chosen for this application. The EZ Rules program also supports the use of average of normals patient data rules, but those are not of interest in this example.
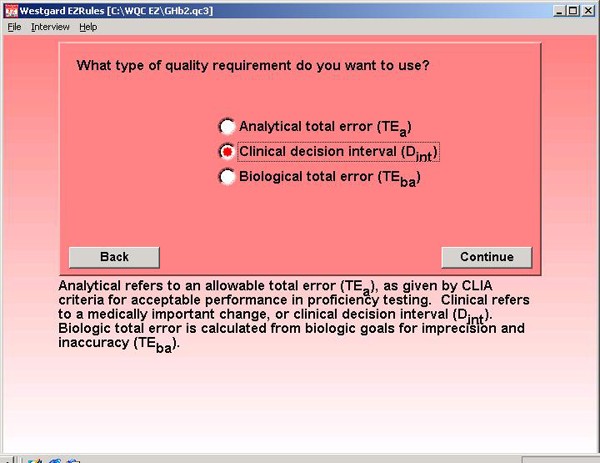
Step 3. A clinical decision interval type of quality requirement is selected because of the information provided in the NACB guidelines. The program can also make use of an allowable total error requirement (CLIA type of criteria) or recommendations for biologic goals (European convention).
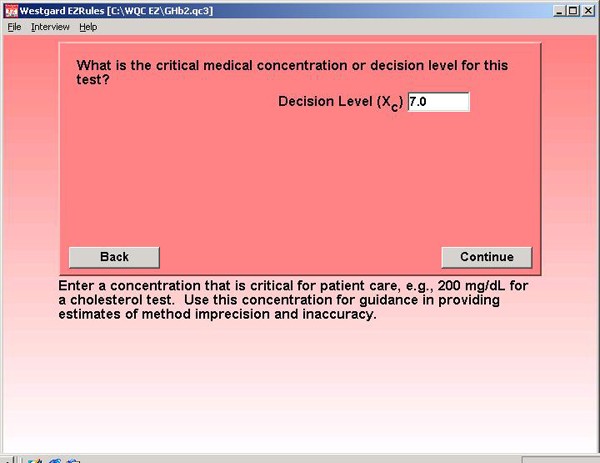
Step 4. The NACB guidelines define a critical decision level at 7.0% GHb. Patients should be maintained at values of 7.0% or lower.
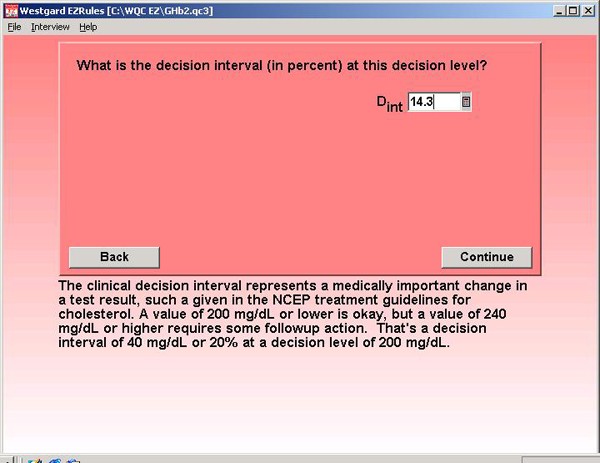
Step 5. The test interpretation guidelines recommend a cutoff point of 8.0 % GHb for re-evaluation of treatment. This change from 7.0 % GHb and 8.0% GHb represents a clinical decision interval of 14.3% (1.0/7). This is entered as percentage because other method performance figures will also be entered as percentages.
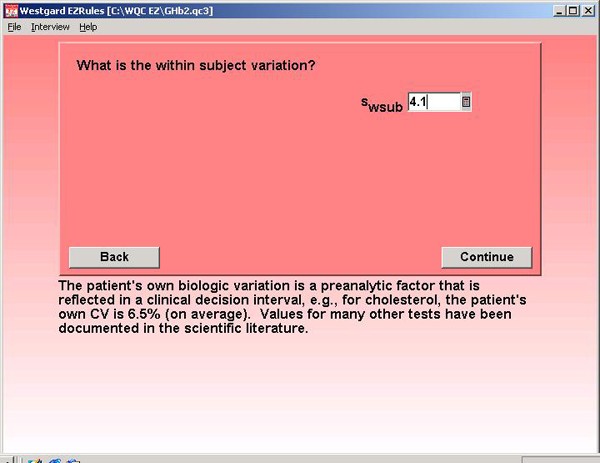
Step 6. When using a clinical decision interval, one important pre-analytical variable that must be considered is within-subject biological variability. Information in the literature provides an estimate of 4.1% [2].
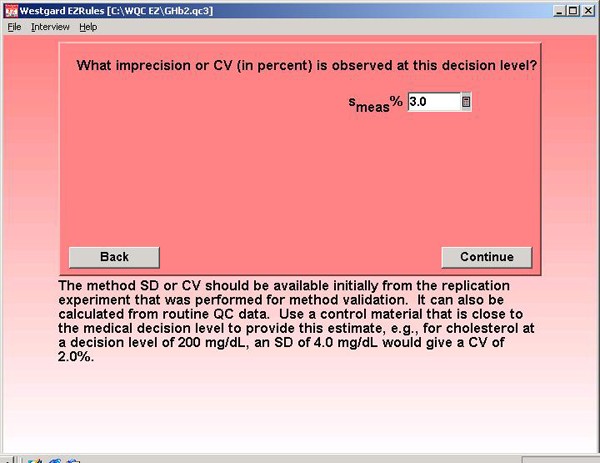
Step 7. For method precision, the NACB specification of 3.0% is entered. This is the desirable CV, but NACB also indicates that methods with CVs up to 5.0% may be used to measure GHb.
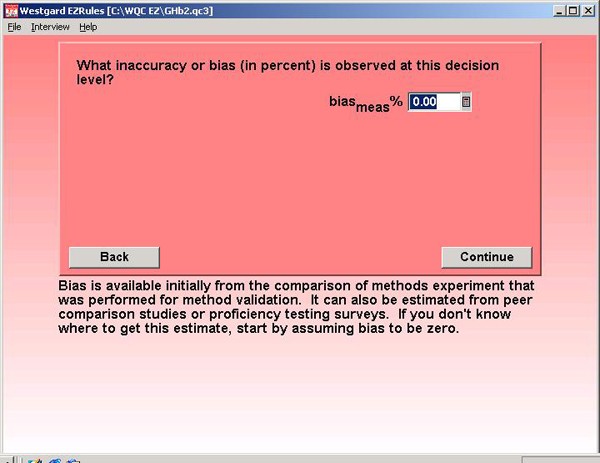
Step 8. For method accuracy, a bias of 0.0% is assumed. This may be optimistic, but GHb methods are supposed to be certified by the National Glycohemoglobin Standardization Program. The figure here assumes that program really works!
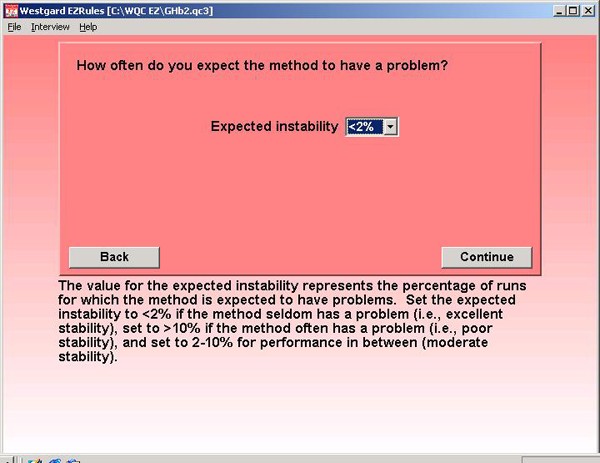
Step 9. The expected instability represents how often the method is expected to have problems. Truth be told, the NACB guidelines assume the method is perfectly stable because they don't consider the rejection characteristics of QC procedures, so <2% is selected to represent excellent stability. If 90% error detection can not be achieved, this setting tells the program to look for 50% error detection.
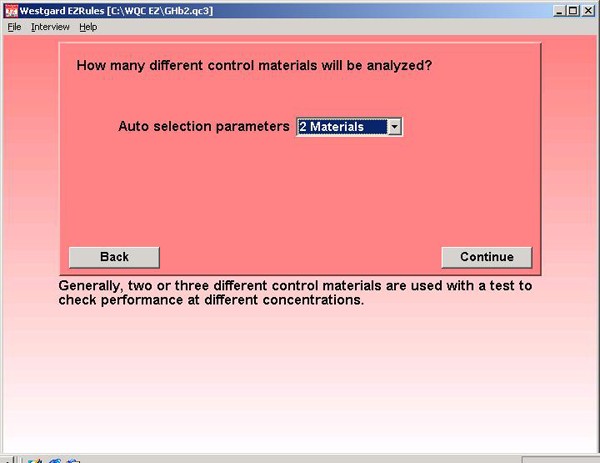
Step 10. The NACB guidelines recommend that two different control materials be analyzed, so we select 2 materials from the drop-down list. It's not clear from the recommendations whether one material should be analyzed at the beginning and one at the end or a run, or whether both should be analyzed at the beginning and end of a run.
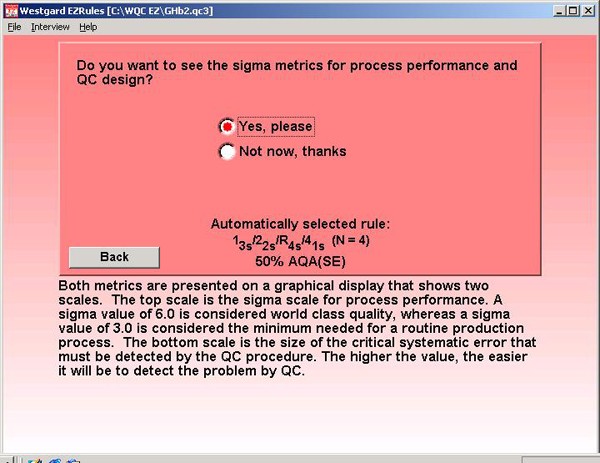
Step 11. Once all this information is entered, the program automatically selects a QC procedure, as shown in this screen. In this case, the selection is a multirule procedure (a "Westgard rule") with a total of 4 control measurements per run. In practice, that means that the two different control materials should each be analyzed twice in an analytical run. Now you can look at the "evidence" to see why this QC procedure has been selected.
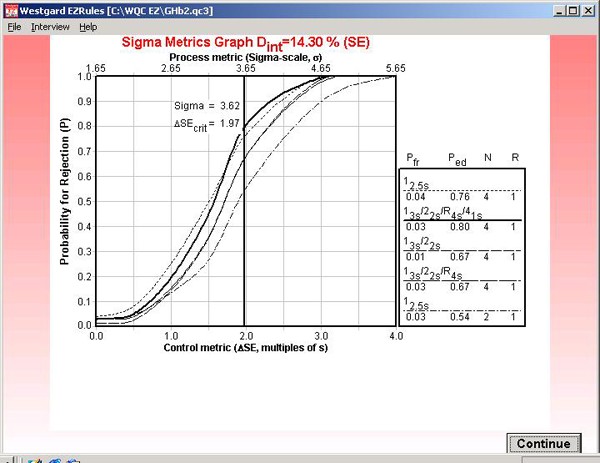
Step 12. This graph is labeled "Sigma Metrics" because it includes the calculated sigma for the testing process (3.62) as well as the critical systematic error (1.97) that is medically important. The intersection of the vertical line and the power curve for the selected multirule QC procedure shows there will be an 80% chance of detecting the medically important systematic error.
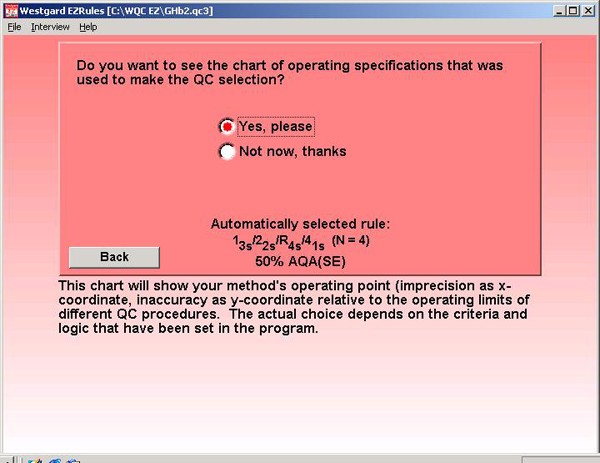
Step 13. The program also lets you view the OPSpecs chart that was used to select the QC procedure. In this case, the information provided on the "automatically selected rule" indicates this will be an OPSpecs chart with 50% AQA(SE), i.e., the QC procedure selected will have at least a 50% chance of detecting the medically important error.
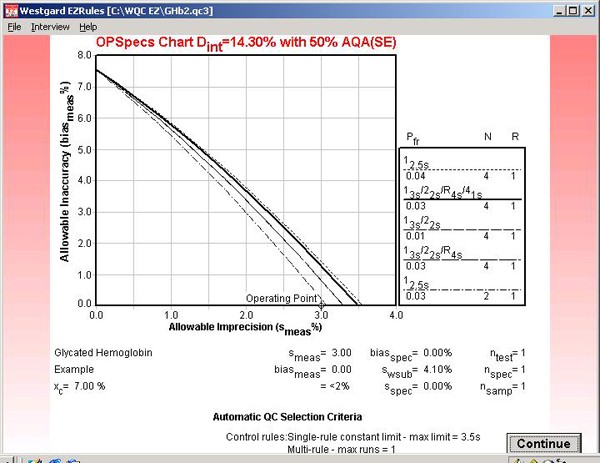
Step 14. This OPSpecs chart has been prepared for the clinical decision interval of 14.3% and 50% AQA(SE) or error detection. It shows the amount of inaccuracy (y-axis) and imprecision (x-axis) that are allowable for the different candidate QC procedures. The performance of an NACB method is shown by the operating point.
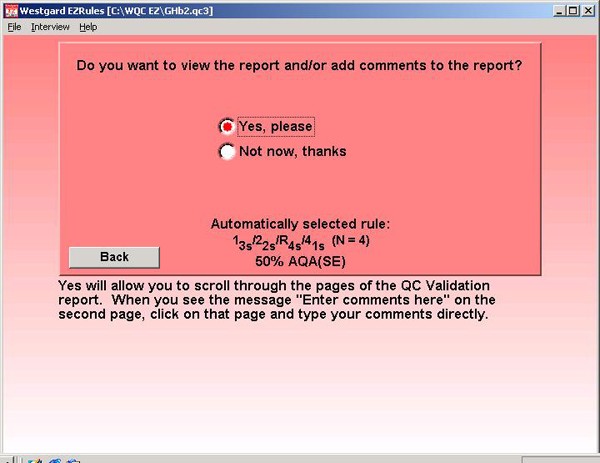
Step 15. Finally, the program allows you to document the parameters entered and the graphs and charts that have been utilized to make the selection and characterize method and QC performance.
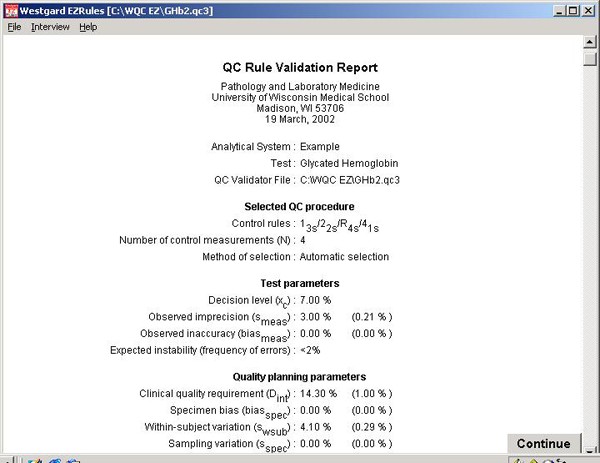
Step 16. The report begins with information about the laboratory, the test, the selected QC procedure, and test or method performance parameters, and the quality-planning parameters. The Sigma Metrics graph and the OPSpecs chart are printed in the report.
References:
- Sacks DB, Bruns DE, Goldstein DE, Maclaren NK, McDonald JM, Parrott M. Guidelines and recommendations for laboratory analysis in the diagnosis and management of diabetes mellitus. Clin Chem 2002;48:436-472.
- Lytken Larsen M, Fraser CG, Hyltoft Petersen P. A comparison of analytical goals for haemoglobin Alc assays derived using different strategies. Ann Clin Biochem 1991;28:272-278.