Basic QC Practices
Would your lab have caught this error, part 2?
A reader-submitted example reminds us how common the use (and mis-use) of manufacturer ranges and package inserts can blind laboratories to the true problems occurring in their methods.
Blind to errors? Would your lab have caught this error, part two?
Submitted by ANONYMOUS
with Sten Westgard
NOVEMBER 2013
One of the great rewards of running Westgard Web is the responsiveness and energy of the readers and visitors to the website. After all, it's rather astounding that anyone would voluntarily visit a website devoted to laboratory statistics. It's a real testament to the professional standards and the commitment of laboratory staff all around the world that we have attracted so many thousnads of visitors.
All of this is prelude to this user-submitted case study of "Blind Man QC" - as demonstrated in the article we posted on a published study of a laboratory missing an error for 10 days. As it happens, this generous and laboratory director recognized the problem shown in the article and had an example of his own to share. However, out of respect to his hospital and staff, all of the names and identifying characteristics have been changed. We're not trying to single out a single lab - we're trying to convince laboratories that they need to make sure they aren't falling into the "widen your limits" trap.
.So without further ado, we'll take a look at the data provided by Anonymous and his comments.
We start with an assayed control with mean of 127, SD of 5. But the calculated values are different: mean of 129 and SD of 2.2. The manufacturer's SD is twice as large as the actually observed performance of the laboratory.
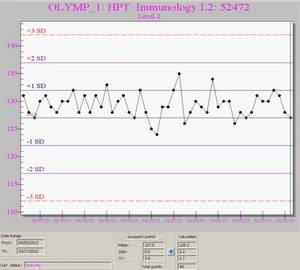
These screen shots are, I admit, hard to see. But even without being able to read the fine details, we can see that this looks like another "string of pearls" where all the data seems to be comfortably within just 1 SD of the mean. This, of course, is because the manufacturer's range is being used to set the control limits.
Now look below and see that the three most recent points mark a change: 118, 117, and 116.
But even though this is a pretty dramatic change, with the manufacturer's SD, it is only just falling below - 2 SD, which will not trigger a Failure in this particular system. Anonymous comments: "The techs do not look at the LJ graphs unless they get a “F”ailure flag. The value of 116 flagged with a “W”arning."
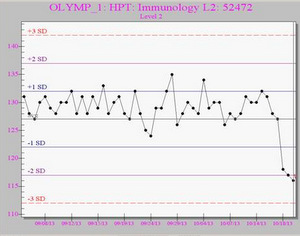
If the correct mean and SD had been used, this is what the Levey-Jennings control chart would look like:
Anonymous comments: "All three points are <3sd. Clearly there is a problem."
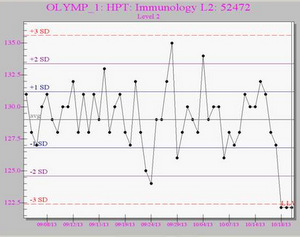
If the laboratory takes a look at all three levels of the controls, there is more confirmation of the problem:
With the manufacturer's SD, all of these values are triggering warnings but not rejections, although possibly if the laboratory was implementing some type of 2of3:2s rule, that would finally trigger a rejection. But according to anonymous, rule implementation was also imperfect.
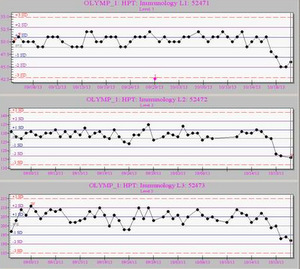
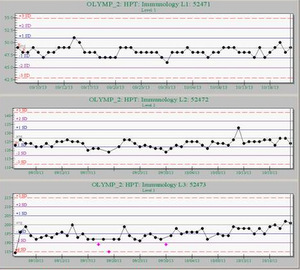
Anonymous comments: "We run this assay on two instruments: Note that the values appear stable. (The means and SD were set incorrectly here [on the second instrument] as well. Note the point on Immunology L2....It has a value of 133, but did not flag. If proper values were used, it would have flagged as nearly 5 SDI! Also note that the points [three dots of different color highlighted on L3, the bottom chart]. If the ranges were correct, these would have been okay."
Conclusion
The problem with the misuse of manufacturer SDs is widespread. When laboratories complain to us that QC is no longer necessary because they don't see any problems, we reply that they've probably blinded themselves to the problems that are occurring right under their noses. When you turn off the lights, you may no longer see the problems, but that doesn't make them cease to exist. Sooner or later, you'll crash into them.
Thanks again to anonymous for sharing this case study. We encourage other labs to share their data as well. Only by looking at real-world data with our eyes wide open can we understand the scope and depth of this problem. If we don't share this data with each other, we're extending our own blindness.