QC Selection Grid, Square 1
This is a discussion of part of the QC Selection Grid.
MULTIRULE CHOICE:
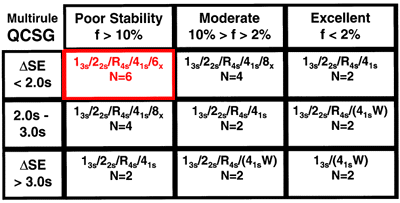
This is a bad situation because you have frequent problems and medically important errors are small and difficult to detect. You should put a priority on improving method performance or even replacing this method. Meanwhile, maximum control should be applied by using a five rule procedure with N=6. All the rules can be applied as rejection rules within a single run. The power curve below shows the rejection characteristics:
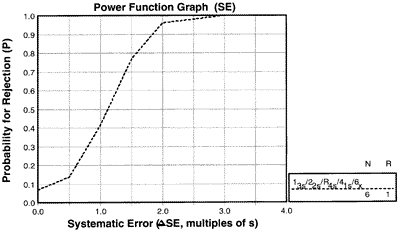
Plot your critical-error on the x-axis of this power function graph. Draw a vertical line from that point to intersect the power curve. Where the two lines meet indicates how much error detection this control rule will provide.