Basic Method Validation
Probit Analysis, Part Two
An earlier post on this website discussed the use of probit analysis for determining the limit of detection (LoD) for Nucleic Acid Amplification Tests (NAAT).
Probit Analysis 2: Issues with Verification of Limit of Detection
James O. Westgard, R. Neill Carey
September 2020
An earlier post on this website discussed the use of probit analysis for determining the limit of detection (LoD) for Nucleic Acid Amplification Tests (NAAT). Probit analysis is a statistical technique that fits the “positivity rate” from replication experiments to a sigmoid or S-shaped curve that represents the cumulative probability function for a Gaussian distribution. For purposes of exploring the use of probit analysis, part 1 of this series described how the method of Finney [1] was implemented via an Excel spreadsheet to compare estimates of LoD with the results of 2 examples in the CLSI EP17-A2 document [2] and 1 example from the literature [3].
- For the EP-17A2 example [2, page 23], our estimate for LoD was 39.2 compared to 36.5;
- For the literature example [3], our estimate was 0.006 PFU/mL compared to 0.005 PFU/mL;
- For the EP-17A2 worked example [2, pages 51-53], our estimate was 0.064 CFU/mL compared to 0.077 CFU/mL.
See even more stories about COVID-19 Laboratory Challenges...
We expect that the results here are within the uncertainty or confidence ranges of the “claimed” LoDs, but determining those confidence limits requires more complicated calculations with statistical software, such as the Maplesoft program described by Vaks [4]. Other programs, such as MedCalc, Analyze-it, or Minitab also support probit analysis and may be more familiar and available to clinical laboratory scientists.
Verification of Claims
Typically, laboratory verification of a manufacturer’s claim involves the laboratory’s performing a “smaller” experiment than that performed by the manufacturer to establish the claim. Then, the acceptability of performance is assessed by comparing the two estimates. This usually involves demonstrating overlap of the confidence interval for the laboratory’s estimate with the manufacturer’s claim, or demonstrating that laboratory estimate falls within the confidence interval of the manufacturer’s claim. Given that the laboratory experiment is smaller, it is expected to have greater uncertainty and a wider confidence interval, thus determining confidence limits by the laboratory may be the preferred approach.
An application of this approach for verifying a cutoff limit, or the C50 concentration in the imprecision interval, has been described in the 4th edition of our book on Basic Method Validation and Verification [5]. The confidence limits for a proportion, such as a hit rate, can be expressed in terms of the number of samples that must be positive in an experiment with a defined number of replicates. For example, for a test sample at a manufacturer’s claimed cutoff, the number of positive samples in an experiment with 20 replicates must be between 6 and14 to verify the claimed C50; in an experiment with 40 replicates, the number of positive should be within the range of 14 to 26. For an estimate of C95 based on a hit rate experiment of 20 replicates, the number of positives should be between 17 and 20; for 40 replicates, between 35 and 40. For higher number of replicates, Vaks provides a table up to 1000 replicates, along with detailed advice on verifying claims for LoDs based directly on hit rates [6].
However, in cases where LoD is estimated by probit analysis, the assessment of agreement between observed and claimed results is more complicated. As pointed out in Part 1 of this discussion, use of probability graph paper is sufficient to make an estimate of LoD, however, calculation of confidence limits to go along with such an estimate requires special statistical software. Because of this, the manufacturer should be responsible to document the confidence limits for their claimed LoDs, as should the authors of published studies of test performance. Then laboratories can assess whether their estimate falls within the range expected by the manufacturer.
Estimating C95 instead of C50
Historically, probit analysis has been used for bio-assays, e.g., to assess the kill rate of insects as a function of the dose of insecticide. The dose-response curve is expected to have a sigmoid shape and the transformation of kill rates to probits should linearize the response, which then allows the data (kill rate vs log concentration) to be analyzed by linear regression. Typically, the midpoint of the dose-response curve, called C50 for the concentration having 50% kill rate, is estimated to characterize the potency of the insecticide. An estimate of C50 is expected to be more reliable than the estimate of C95 (corresponding to the concentration for the 95% hit rate) that is used for the LoD of NAAT tests. Characterizing the reliability requires calculation of confidence limits, which is a more complicated task that often requires special statistical software.
Manufacturers’ claims for Emergency Use Authorization often estimate LoD directly based on the 95% positivity rate for a single concentration out of a series of dilutions, thus avoiding the use of probit analysis. For studies by manufacturers and those published in the literature that do use probit analysis, the estimates of LoDs are often limited by the number of data points in the “imprecision interval” from C5 to C95. Concentrations that yield hit rates of 0% and 100% are generally not useful when transforming to probits to linearize the data, thus limiting the number of useful data points.
Estimating C95 rather than C50 creates a larger uncertainty or wider confidence limits because of extrapolation away from the mean of the data. In that context, the use of probit analysis for estimating the LoD of NAAT tests may not be an optimum approach. Nevertheless, that is the approach recommended by the CLSI EP17-A2 guidance as the best laboratory practice.
Fiducial confidence limits for LoD
The analytical LoD is the best predictor of clinical sensitivity, thus determination of LoD is of great importance for characterizing the performance of qualitative tests. It is standard practice that estimates of clinical sensitivity (Se) and clinical specificity (Sp), or positive percent agreement (PPA) and negative percent agreement (NPA), be accompanied by 95% confidence intervals [7]. Thus, it might be expected that claims for LoDs should also be accompanied by confidence intervals. The CLSI EP17-A2 guidance does not specifically address the need for confidence limits for the estimates of LoDs, but the “worked” example in Appendix C does provide a graph that shows such confidence intervals. The software used for analysis of the data in this example is not specified.
To provide more clearly documented estimates, we have utilized the Minitab statistical package [8] to assess the expected reliability of the LoDs for the examples described in Part 1 of this series. Minitab has a defined probit analysis routine that is simple to use. The probit analysis screen is shown below. The user can specify the “response in event/trial format”, which means the data will be entered for the number of events (positive results) and the total number of trials. These are the raw numbers used to calculate “hit rates” or the proportion of positive results. The user also specifies the “stress” which corresponds to “dose” or “concentration”. In this case, the concentrations were converted to the log 10 scale. The raw data were then entered in the Minitab “worksheet” where the columns are identified as “Conc”, ”Log10conc”, “Ntotal”, and “NPos.”
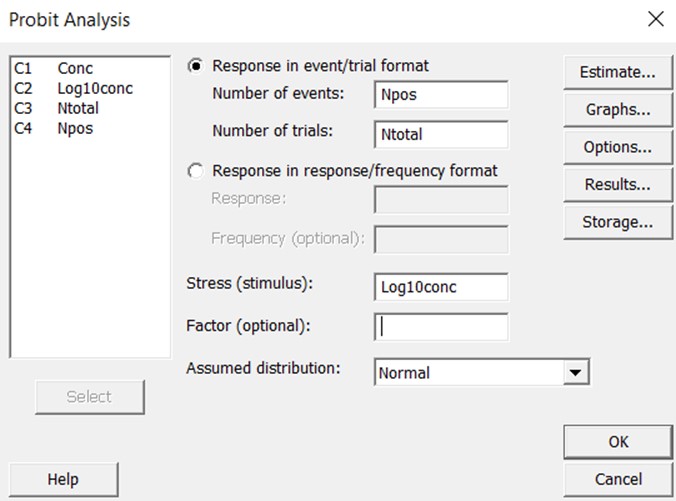
The graphical output then shows the line of best fit and the confidence limits about that line. Extensive statistical results are available to assess goodness of fit, uncertainty in the estimates of the slope and intercept, standard error about the regression line, and predictions of “fiducial confidence limits” for each percentile value.
Fiducial confidence limits describe the expected range of possible dose concentrations (x-values) that correspond to a certain probit (y-value). Traditional confidence limits work the other way around. They describe the expected range of y-values for an x-value of interest. For example, in characterizing the uncertainty when directly estimating LoD as the concentration with 95% hit rate (detection rate, positivity rate), the limits are applied to the proportion that represents the hit rate to describe the range of positive results that are expected out of a certain number of replicates. The fiducial confidence limits associated with probit analysis are used to define the range of concentrations that can be ascribed to a kill rate of 50%, i.e., the limits apply to the value on the x-axis rather than the y-axis. In the application for LoD where the y-value of 95% is by definition the limit of detection, fiducial limits provide an estimate of the range of concentrations that might characterize C95.
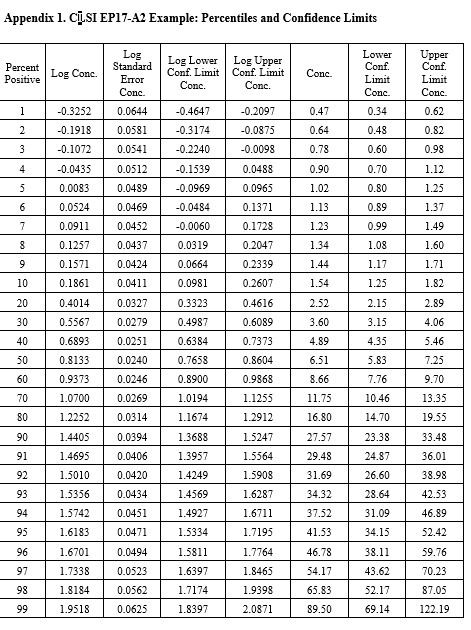
CLSI EP17-A2 Example (page 23)
This is the example that was reconstructed from the graphical results presented in the EP17-A2 document. This example was used to illustrate the transformation of the “hit rate” curve to the probit straight line that was used for regression and prediction of the C95 concentration.
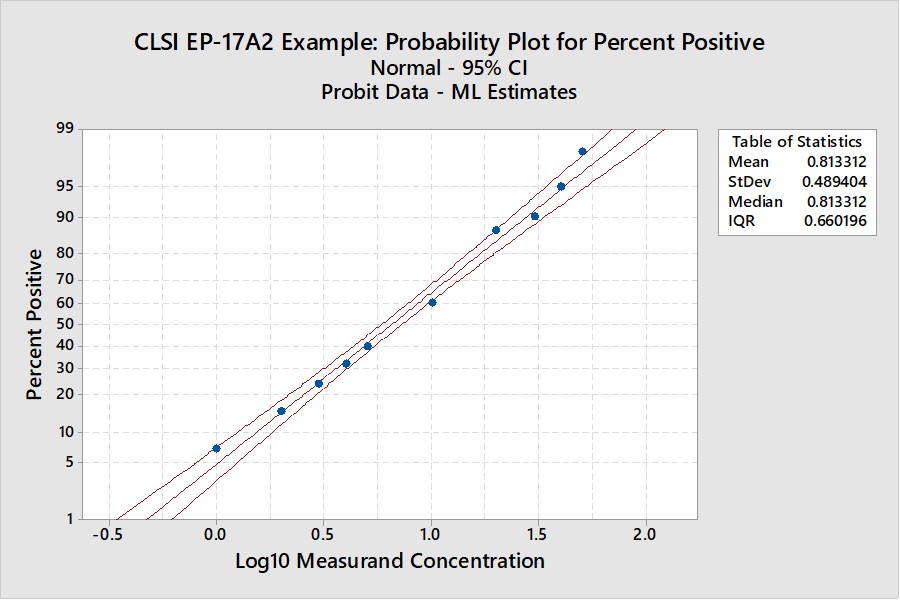
Notice that the y-axis here is scaled for the cumulative probability distribution and the x-axis for the log of the concentration. An accompanying table (See Appendix 1) provides upper and lower fiducial confidence limits for every percentile from 1 through 99. For a the C95 of 41.5, the fiducial limits are 34.1 to 52.5.
Recall that the estimate for the LoD by our earlier probit regression was 39.2 and the CLSI result was 36.5. Both of these estimates fall within the fiducial confidence limits estimated by the Minitab program and the agreement between these 3 different calculations can be considered within the uncertainty of the methods. But, remember that this is an unusually good set of data with 10 points in the useful probit range. The lower confidence limit is 18% lower than the C95 estimate and the upper confidence limit is 26% higher. That’s approximately ± 20% for the likely “best case” experimental data.
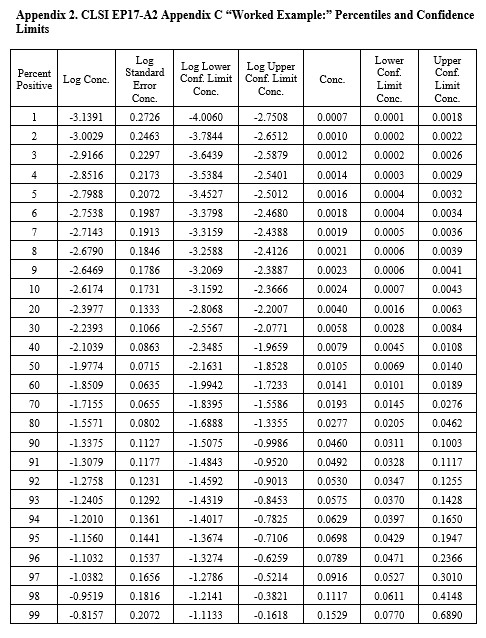
CLSI EP17-A2 “Worked Example”
For this example in Appendix C of EP17-A2 (pages 51-53), there were only 4 useful points, as shown below:
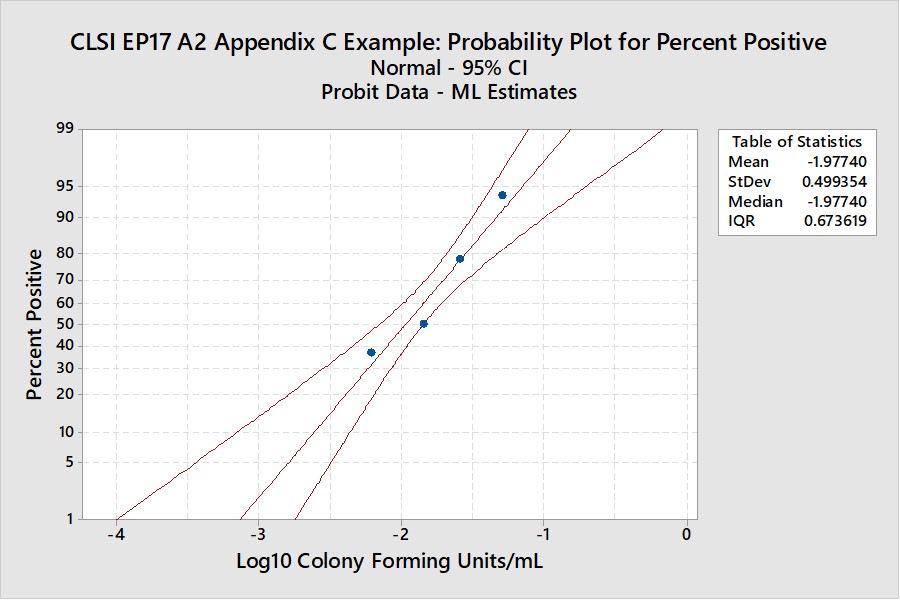
The width of the confidence interval is much larger because of fewer points and a narrower range of concentrations. See Appendix 2 for upper and lower fiducial confidence limits for each percentile. C95 is estimated as 0.0698 CFU/mL with confidence limits of 0.0429 and 0.195. Our earlier estimate from probit regression was 0.064 CFU/mL, compared to the EP17 answer of 0.077 CFU/mL. Both of these estimates fall within the expected confidence limits from the Minitab calculations. In percentages, the EP17 answer is 10% larger than the Minitab estimate, whereas our Finney probit estimate is about 8% smaller. The lower confidence limit for the Minitab estimate is 39% lower than the point estimate and the upper confidence limit is 79% higher. The uncertainty of the LoD estimate at C95 is therefore quite large, twice as large as observed for the EP17 example having 10 data points.
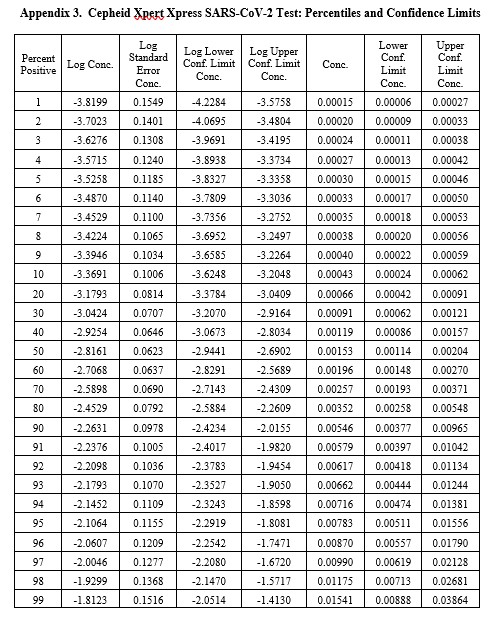
Real-World Example
This example is for the Cepheid Xpert Xpress SARS-CoV-2 test where 7 concentrations were evaluated by experiments involving 22 replicates, with hit rates ranging from 4.5% to 100%. The graphical results for concentrations with less than 100% hit rates are shown below:
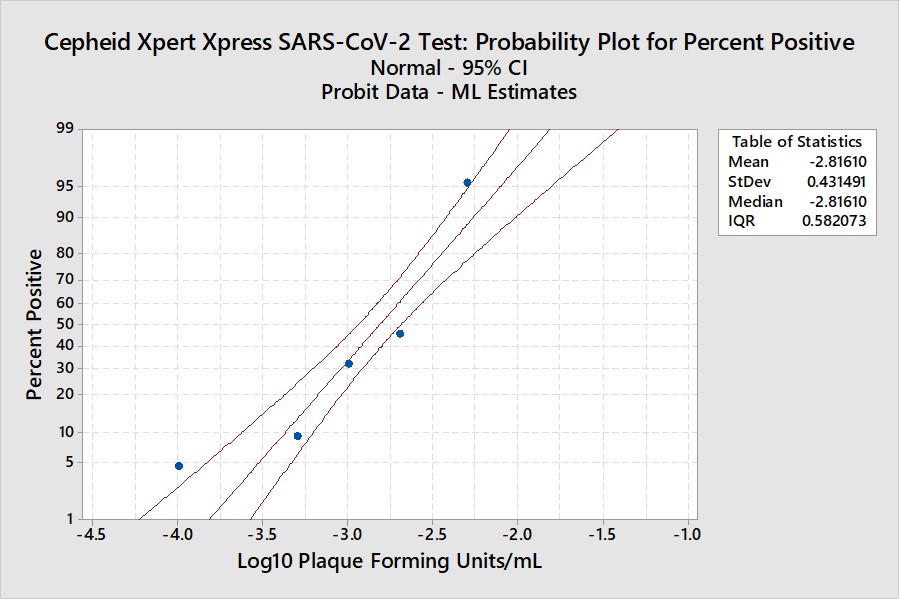
The LoD estimate for C95 is 0.00782 PFU/mL with confidence limits of 0.0051 PFU/mL (35% lower) and 0.0156 PFU/mL (98% higher). See Appendix 3 for fiducial limits. Our earlier estimate from the Finney probit model using 5 points was 0.010 PFU/mL compared to the literature claim of 0.005 PFU/mL. Using the Finney model with only 4 points gave an LoD of 0.006 PFU/mL. All of these estimates fall within the confidence limits determined by the Minitab model, but again the uncertainty in the estimates is seen to be large.
What’s the point?
These examples illustrate that the estimation of LoDs for NAAT methods by use of probit analysis may have large uncertainties as assessed by calculation of fiducial confidence limits. The best case may be ± 20%, but uncertainties from 40% to 100% may be more realistic. Given the importance of analytical sensitivity in influencing clinical sensitivity, it would seem that better protocols are needed to assure better estimates of this critical performance characteristic and that the current EP17-A2 guidance for use of probit analysis is not adequate.
For laboratories, instead of probit analysis, we recommend the simpler direct estimation by 95% hit rate that also provides a simpler approach for verification of claims using confidence intervals for proportions (expressed in terms of the number of positives expected out of an experiment with a specified number of replicates). However, laboratories should pay more attention to preparing the appropriate dilution series and more carefully studying those concentrations near C95. The graphical use of probability paper may provide an initial estimate of LoD that can lead to a more thorough investigation of multiple concentrations to obtain a final estimate of C95. This should be a more practical approach for laboratories to assess LoD, as well as providing a simpler approach for verification of a manufacturer’s claim.
References
- Finney DJ. Probit Analysis: A Statistical Treatment of the Sigmoid Response Curve. Cambridge University Press, Cambridge and London, 1947.
- CLSI EP17-A2. Evaluation of Detection Capability for Clinical Laboratory Measurement Procedures. Clinical and Laboratory Standards Institute, 940 West Valley Road, Suite 1400, Wayne, PA, 2012.
- Loeffelholz MJ, Alland D, Butler-Wu SM, et al. Multicenter evaluation of the Cepheid Xpert Xpress SARS-CoV-2 test. https://doi:10.1128/JCM.00926-20.
- Vaks JE. New method of evaluation of limit of detection in molecular diagnostics. Joint Statistical Meeting, Vancouver, Canada, July 28 – Aug 2, 2018. [Google search for Vaks probit analysis should give Maplesoft.com source]
- Westgard JO. Basic Method Validation and Verification, 4th Westgard QC, Inc., Madison WI, 2020.
- Vaks JE, Hemyari P, Rulikoetter M, et al. Verification of claimed limit of detection in molecular diagnostics. J Appl Lab Med 2016;1:260-270.
- CLSI EP12-A2. User Protocol of Evaluation of Qualitative Test Performance. Clinical and Laboratory Standards Institute, 940 West Valley Road, Suite 1400, Wayne, PA, 2008.
- Minitab 18, Minitab Statistical Software®, Quality Plaza, 1829 Pine Hall Rd., State College, PA 16801.
Appendices