Sigma Metric Analysis
Sigma-metrics of a Sysmex XN-2000
We've been looking at a number of hematology instruments recently. It's time to look at one of the market-leading instruments from Sysmex.
IMPORTANT: Correction of an error in the original study has been made.
Sigma-metrics of a Sysmex XN-2000 automated hematology analyzer
- The Precision and Comparison data
- Determine quality requirements at the critical decision level
- Calculate Sigma metrics
- Summary of Performance by Sigma-metrics chart and OPSpecs Chart
- Conclusion
July 2016
Sten Westgard, MS
| [Note: This QC application is an extension of the lesson From Method Validation to Six Sigma: Translating Method Performance Claims into Sigma Metrics. This article assumes that you have read that lesson first, and that you are also familiar with the concepts of QC Design, Method Validation, and Six Sigma. If you aren't, follow the link provided.] |
We've been looking at a number of hematology instruments in previous months, and it's time we look at one from the biggest player, Sysmex:
Local verification between the hematological analyzers Sysmex XN-series and XE-5000.
IMPORTANT: Correction 2018
From the study authors:
"[W]e have detected two errors in the regression equation of the Hematocrit (HTO), Hemoglobin (HGB) and mean cell volume (VCM) as shown below:
First- In the regression equations of HTO and HGB there is a conversion error in the units that leads to an incorrect intercept value. We should point out that in our laboratory we use non-standard international measurement units in these parameters and that we converted the values to international units for the publication.
Second- The regression equations of parameters HTO and VCM have been interchanged by mistake in the process of publication.
The following equations show the corrected resulting lines:
HTO y= -0.014 + 1.06x
HGB y= -2.5 + 1.04x
VCM y= 0.33 + 1.01x
Nevertheless, the conclusions and the estimations written in our publication are correct as they have been obtained from the original results in the units of measurement of our laboratory.
Unfortunately the Sigma-metric estimations made in your publication (in Westgard web mentioned before), are not correct since you used the incorrect regression lines taken from our publication.
We have performed the sigma metrics analysis with two analytes.
Results for the Bias and Sigma using the corrected regression lines should be the following:
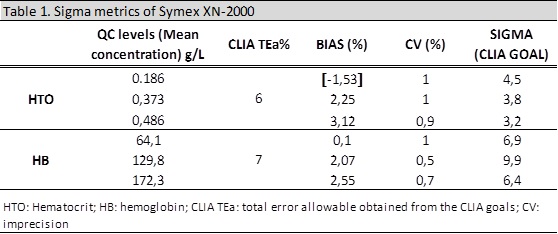
Finally we have represented correctly the Bias and CV using a Normalized Sigma-metric Method Decision Chart.
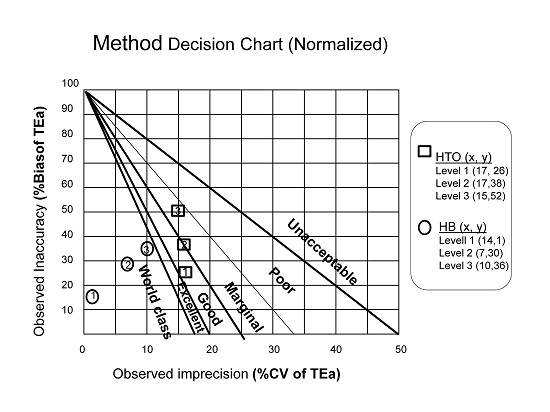
Considering these results obtained with the sigma-metric analysis of hematocrit and hemoglobin we conclude a satisfactory performance of Sysmex XN.
We have sent a corrigendum to International journal of laboratory hematology and they have published in the International journal of laboratory hematology, 40(1),103
We apologize for the inconveniences that these mistakes may cause to you. We hope that this experience will make us improve our procedures."
The original article with analysis of the incorrect regression equations is retained below:
The Imprecision and Bias Data
For imprecision, "Three concentration levels (high, normal and low) of quality control material XN-CHECK (Sysmex Europe GmbH....) were employed for between-batch precision measurement. For 30 days three concentration levles were analyzed in duplicate." This is a good amount of data to collect for a verification study.
For bias, the spent one month analyzing 260 whole blood samples on both analyzers. Passing-Bablock regression analysis was carried out on the resulting data.
We're going to focus on nine analytes here for Sigma-metric analysis: WBC, Lymphocytes, RBC, Hemoglobin, Platelets, Hematocrit, Neutrophils, Monocytes, Eosinophils, and Basophils.
| Assay | Level |
CV% | slope | y-intercept | Bias% |
| WBC | 3.2 | 1.7% | 1.0645 | -0.029 | |
| 7.05 | 1.0% | ||||
| 16.54 | 1.9% | ||||
| Lymphocytes | 1.05 | 3.4% | 1.07 | 0 | |
| 1.96 | 3.1% | ||||
| 4.03 | 3.8% | ||||
| RBC | 2.38 | 0.6% | 1.06 | -0.19 | |
| 4.4 | 0.5% | ||||
| 5.38 | 0.5% | ||||
| Hemoglobin | 64.1 | 1.0% | 1.04 | -0.25 | |
| 129.8 | 0.5% | ||||
| 172.3 | 0.7% | ||||
| Platelets | 49.34 | 5.3% | 1.07 | 1.02 | |
| 254.1 | 2.3% | ||||
| 567.3 | 1.8% | ||||
| Hematocrit | 0.186 | 1.0% | 1.08 | 0 | |
| 0.373 | 1.0% | ||||
| 0.486 | 0.9% | ||||
| Neutrophils | 1.23 | 1.8% | 1.08 | 0 | |
| 3.05 | 3.1% | ||||
| 7.77 | 7.8% | ||||
| Monocytes | 0.47 | 0.5% | 1.01 | 0 | |
| 1 | 1.0% | ||||
| 2.14 | 2.1% | ||||
| Eosinophils | 0.3 | 5.3% | 1.06 | 0 | |
| 0.7 | 6.8% | ||||
| 1.8 | 7.2% | ||||
| Basophils | 0.15 | 2.4% | 1.24 | 0 | |
| 0.34 | 1.8% | ||||
| 0.79 | 1.7% |
Notice, we haven't calculated the bias yet. Since we have three levels of imprecision, we can calculate bias at each of those levels.
The study determined the correlation coefficient, slope and y-intercept. The regression equation can be used to determine the difference between the Mindray and a Sysmex XE 2100.
Newlevel = (slope * Oldlevel ) + Y-intercept
As an example, let's take WBC, where the study determined a slope of 1.0084 and y-intercept of -0.042.
Newlevel1 = (1.0645 * 3.2 ) - 0.0292
Newlevel1 = (3.406) -0.0292
Newlevel1 = 3.377
The bias between the old and new level is the absolute value of the difference between 3.377 - 3.2 = 0.177
This is a 5.5% bias at the level of 3.2.
Now we'll just fill in all the biases...
| Assay | Level |
CV% | slope | y-intercept | Bias% |
| WBC | 3.2 | 1.7% | 1.0645 | -0.029 | 5.5% |
| 7.05 | 1.0% | 6.0% | |||
| 16.54 | 1.9% | 6.3% | |||
| Lymphocytes | 1.05 | 3.4% | 1.07 | 0 | 3.4% |
| 1.96 | 3.1% | 3.1% | |||
| 4.03 | 3.8% | 3.8% | |||
| RBC | 2.38 | 0.6% | 1.06 | -0.19 | 2.2% |
| 4.4 | 0.5% | 1.4% | |||
| 5.38 | 0.5% | 2.2% | |||
| Hemoglobin | 64.1 | 1.0% | 1.04 | -0.25 | 3.5% |
| 129.8 | 0.5% | 3.7% | |||
| 172.3 | 0.7% | 3.7% | |||
| Platelets | 49.34 | 5.3% | 1.07 | 1.02 | 9.0% |
| 254.1 | 2.3% | 7.3% | |||
| 567.3 | 1.8% | 7.1% | |||
| Hematocrit | 0.186 | 1.0% | 1.01 | 0.33 | 177.5% |
| 0.373 | 1.0% | 88.9% | |||
| 0.486 | 0.5% | 68.4% | |||
| Neutrophils | 1.23 | 0.5% | 1.08 | 0 | 8.5% |
| 3.05 | 1.0% | 8.4% | |||
| 7.77 | 2.1% | 8.4% | |||
| Monocytes | 0.47 | 0.5% | 1.01 | 0 | 0.2% |
| 1 | 1.0% | 0.4% | |||
| 2.14 | 2.1% | 0.5% | |||
| Eosinophils | 0.3 | 5.3% | 1.06 | 0 | 5.6% |
| 0.7 | 6.8% | 5.6% | |||
| 1.8 | 7.2% | 5.6% | |||
| Basophils | 0.15 | 2.4% | 1.24 | 0 | 25.6% |
| 0.34 | 1.8% | 24.8% | |||
| 0.79 | 1.7% | 24.5% |
Most of this looks great, but there are a few numbers here that pop out. The biases for Hematocrit and Basophils, for example, seem very high.
Some might object to the use of the word "bias" as we don't have a comparison against a reference method, but merely the comparison between two field methods. But this is a scenario many customers of Sysmex are likely to encounter, if they upgrade from XE-5000 to the XN-2000. Patient results will be impacted by these discrepancies or differences between results. Either the clinicians need to be informed so they can adjust their interpretations accordingly, or there will need to be a correction or recalibration to get these biases eliminated.
Determine Quality Requirements at the decision levels
Now that we have our imprecision and bias data, we're almost ready to calculate our Sigma-metrics. We're just missing one critical component: the analytical quality requirement. In this example, we're going to use several different sets of quality requirements to judge the method. We'll start just by using the "Ricos Goals" for imprecision and bias separately. Next, we'll use the CLIA proficiency testing criteria, which sets specifications for some hematology parameters. Where CLIA doesn't regulate an analyte (for example lymphocytes), we'll use the "Ricos goals" or perhaps the "Spanish minimum". We're also adding some new goals specified by Vis and Huisman, State of the Art Hematology goals for 2016 (SOTA CV and SOTA Bias, respectively).
Here's a comparative table of the different quality goals available:
| Assay | SOTA CV |
SOTA bias |
Ricos CV% |
Ricos Bias% | Ricos TEa% | CLIA TEa% | Spanish Minimum TEa% |
Rilibak TEa% |
| WBC | 1.5- 6.0% | 4.4% | 5.73% | 6.05% | 15.44% | 15% | 9.0% | 12.0% |
| RBC | 1.1% | 3.2% | 1.6% | 1.7% | 4.4% | 6.0% | 4.0% | 8.0% |
| HGB | 1.0% | 1.3% | 1.43% | 1.84% | 4.19% | 7.0% | 5.0% | 6.0% |
| PLT | 3.0 - 5.0% | 6.4% | 4.6% | 5.9% | 13.4% | 25.0% | 16.0% | -- |
| Lymphocytes | 3.5% | 5.0% | 5.1% | 9.19% | 17.6% | -- | -- | -- |
| Hematocrit | 1.4% | 1.8% | 1.35% | 1.74% | 3.97% | 6% | 8% | 9.0% |
| Neutrophils | 2.5 - 10% | 3.2% | 8.55% | 9.25% | 23.35% | -- | -- | -- |
| Monocytes | 8.5% | 15% | 8.9% | 13.2% | 27.9% | -- | -- | -- |
| Eosinophils | 10% | 13% | 10.5% | 19.8% | 37.1% | -- | -- | -- |
| Basophils | 20% | 32% | 14.0% | 15.4% | 38.5% | -- | -- | -- |
Judging on imprecision and bias separately, using the Ricos and SOTA 2016 desirable maximum allowable specifications, we'll highlight in green where performance is acceptable, and highlight in red where performance is unacceptable:
| Assay | Level |
CV% | Bias% | SOTA CV acceptable? |
SOTA bias acceptable? |
Ricos CV acceptable? |
Ricos bias acceptable? |
| WBC | 3.2 | 1.7% | 5.5% | Yes | No | Yes | Yes |
| 7.05 | 1.0% | 6.0% | Yes | No | Yes | Yes | |
| 16.54 | 1.9% | 6.3% | Yes | No | Yes | Yes | |
| Lymphocytes | 1.05 | 3.4% | 3.4% | Yes | Yes | Yes | Yes |
| 1.96 | 3.1% | 3.1% | Yes | Yes | Yes | Yes | |
| 4.03 | 3.8% | 3.8% | No | Yes | Yes | Yes | |
| RBC | 2.38 | 0.6% | 2.2% | Yes | Yes | Yes | No |
| 4.4 | 0.5% | 1.4% | Yes | Yes | Yes | No | |
| 5.38 | 0.5% | 2.2% | Yes | Yes | Yes | No | |
| Hemoglobin | 64.1 | 1.0% | 3.5% | Yes | No | Yes | No |
| 129.8 | 0.5% | 3.7% | Yes | No | Yes | No | |
| 172.3 | 0.7% | 3.7% | Yes | No | Yes | No | |
| Platelets | 49.34 | 5.3% | 9.0% | No | No | No | No |
| 254.1 | 2.3% | 7.3% | Yes | No | No | No | |
| 567.3 | 1.8% | 7.1% | Yes | No | No | No | |
| Hematocrit | 0.186 | 1.0% | 177.5% | Yes | No | Yes | No |
| 0.373 | 1.0% | 88.9% | Yes | No | Yes | No | |
| 0.486 | 0.5% | 68.4% | Yes | No | Yes | No | |
| Neutrophils | 1.23 | 0.5% | 8.5% | Yes | No | Yes | Yes |
| 3.05 | 1.0% | 8.4% | Yes | No | Yes | Yes | |
| 7.77 | 2.1% | 8.4% | Yes | No | Yes | Yes | |
| Monocytes | 0.47 | 0.5% | 0.2% | Yes | Yes | Yes | Yes |
| 1 | 1.0% | 0.4% | Yes | Yes | Yes | Yes | |
| 2.14 | 2.1% | 0.5% | Yes | Yes | Yes | Yes | |
| Eosinophils | 0.3 | 5.3% | 5.6% | Yes | Yes | Yes | Yes |
| 0.7 | 6.8% | 5.6% | Yes | Yes | Yes | Yes | |
| 1.8 | 7.2% | 5.6% | Yes | Yes | Yes | Yes | |
| Basophils | 0.15 | 2.4% | 25.6% | Yes | Yes | Yes | No |
| 0.34 | 1.8% | 24.8% | Yes | Yes | Yes | No | |
| 0.79 | 1.7% | 24.5% | Yes | Yes | Yes | No |
There are more areas of agreement than disagreement. But it's striking to see that the State of the Art goals are about as stringent as the Ricos goals. The Ricos goals reject the methods 18 times vs. only 17 times for the State of the Art goals.
That's the simple comparison of two separate components. What about using Sigma-metrics and allowable total error? Would that deliver the same verdict, or a different one?
Calculate Sigma metrics
Sigma-metrics takes both imprecision and bias into account in a single equation. We're going to calculate Sigma-metrics using CLIA goals when available and "Ricos goals" when they are not.
Remember the equation for Sigma metric is (TEa - bias%) / CV.
Example calculation: for WBC, with a 15% quality requirement, given 1.7% imprecision and 5.5% bias:
(15 - 5.5) / 1.7 = 9.5 / 1.7 = 5.5 Sigma
Similar to the judgement we made earlier with separate components, this Sigma-metric verdict on this WBC assay is good.
So here's the table with all the Sigma-metrics using CLIA and Ricos Goals:
| Assay | Level |
CV% | slope | y-intercept | Bias% | Sigma-metric |
| WBC | 3.2 | 1.7% | 1.0645 | -0.029 | 5.5% | 5.5 |
| (CLIA goal) | 7.05 | 1.0% | 6.0% | 8.8 | ||
| 16.54 | 1.9% | 6.3% | 4.5 | |||
| Lymphocytes | 1.05 | 3.4% | 1.07 | 0 | 3.4% | 3.4 |
| (Ricos goal) | 1.96 | 3.1% | 3.1% | 3.6 | ||
| 4.03 | 3.8% | 3.8% | 2.9 | |||
| RBC | 2.38 | 0.6% | 1.06 | -0.19 | 2.2% | 6.0 |
| (CLIA goal) | 4.4 | 0.5% | 1.4% | 9.5 | ||
| 5.38 | 0.5% | 2.2% | 7.3 | |||
| Hemoglobin | 64.1 | 1.0% | 1.04 | -0.25 | 3.5% | 3.6 |
| (CLIA goal) | 129.8 | 0.5% | 3.7% | 6.4 | ||
| 172.3 | 0.7% | 3.7% | 4.9 | |||
| Platelets | 49.34 | 5.3% | 1.07 | 1.02 | 9.0% | 3.0 |
| (CLIA goal) | 254.1 | 2.3% | 7.3% | 7.9 | ||
| 567.3 | 1.8% | 7.1% | 9.8 | |||
| Hematocrit | 0.186 | 1.0% | 1.01 | 0.33 | 177.5% | negative |
| (CLIA goal) | 0.373 | 1.0% | 88.9% | negative | ||
| 0.486 | 0.5% | 68.4% | negative | |||
| Neutrophils | 1.23 | 0.5% | 1.08 | 0 | 8.5% | 8.3 |
| (Ricos goal) | 3.05 | 1.0% | 8.4% | 4.9 | ||
| 7.77 | 2.1% | 8.4% | 1.9 | |||
| Monocytes | 0.47 | 0.5% | 1.01 | 0 | 0.2% | >6 |
| (Ricos goal) | 1 | 1.0% | 0.4% | >6 | ||
| 2.14 | 2.1% | 0.5% | >6 | |||
| Eosinophils | 0.3 | 5.3% | 1.06 | 0 | 5.6% | 6.0 |
| (Ricos goal) | 0.7 | 6.8% | 5.6% | 4.7 | ||
| 1.8 | 7.2% | 5.6% | 4.4 | |||
| Basophils | 0.15 | 2.4% | 1.24 | 0 | 25.6% | 5.5 |
| (Ricos goal) | 0.34 | 1.8% | 24.8% | 7.6 | ||
| 0.79 | 1.7% | 24.5% | 8.1 |
Overall, there are a lot of good and great metrics here. There are a few analytes where there is one level out of the three that doesn't look great, but that should be evaluated by the individual laboratory. If your laboratory focuses on patients and decision levels at the upper end of the range, a poor metric at the lower end shouldn't be too concerning. We typically advice labs to choose just one level of a test to concentrate on for the Sigma-metric and QC Design.
Certainly there are some significant bias/difference issues with Hematocrit. These differences are so large as to exceed the allowable total error. As we mentioned earlier, this means that action needs to be taken either within the laboratory through method recalibration or adjustment, or outside the laboratory through clinician re-education of the new range that will be reported out.
Summary of Performance by Sigma-metrics Method Decision Chart and OPSpecs chart
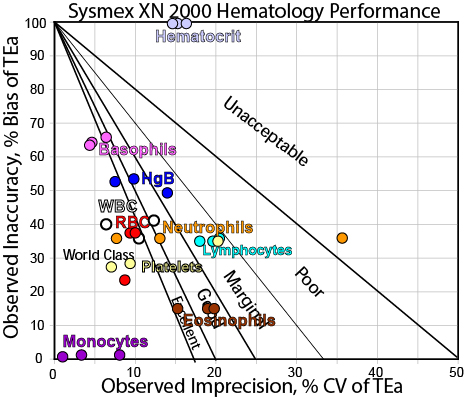
We can make visual assessments of this performance using a Normalized Sigma-metric Method Decision Chart:
Now what about QC? How do we monitor and control these methods? For that, we need a Normalized OPSpecs chart:
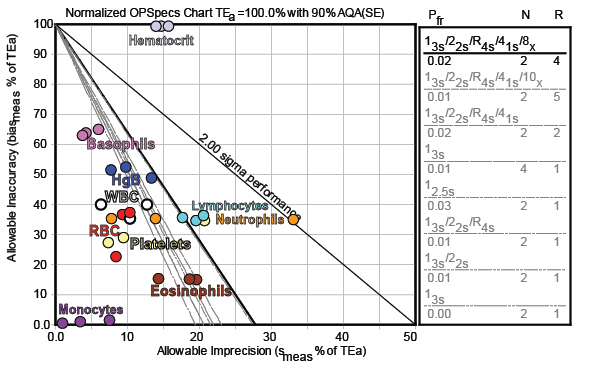
Most of the methods are easily controllable with only 2 controls and 3s control limits. Lymphocytes probably need the full "Westgard Rules". Even where there is significant bias/difference, the performance for many analytes are still within the bullseye. A few of the points are a bit far away from the bull's eye, but possibly the level at which those metrics were measured are not as critical. For Hgb, Eosinophils, and Neutrophils, the QC Design will depend on which level is the most critical, but even in the worst case, a set of "Westgard Rules" can most provide all the error detection needed. Hematocrit is the lone concern here, where again that bias/discrepancy needs to be addressed. If it is simple a difference in methodology between the old and new models of Sysmex instrumentation, then the proper action may be to re-educate clinicians about the reference range of the results.
Conclusion
The authors concluded "to conclude, the global results obtained for precision, comparability and efficiency provide a satisfactory integration (acceptability) of the XN-2000 in the core laboratory routine and accomplish an optimal reliability."
Based on Sigma-metric analysis, we basically agree.