Sigma Metric Analysis
Three POC HbA1c methods
An abstract from the 2010 AACC/ASCLS meeting compared Three POC Analyzers for HbA1c. Given the recent study from Lenters-Westra and Slingerland (where 6 out of 8 analyzers couldn't meet the standards for analytical performance), how do these three devices fare?
- The Precision and Comparison data
- Determine quality requirements at the critical decision level
- Calculate Sigma metrics
- Summary of Performance by Sigma-metrics chart and OPSpecs Chart
- Conclusion
July 2010
Sten Westgard, MS
 |
[Note: This QC application is an extension of the lesson From Method Validation to Six Sigma: Translating Method Performance Claims into Sigma Metrics. This article assumes that you have read that lesson first, and that you are also familiar with the concepts of QC Design, Method Validation, and Six Sigma. If you aren't, follow the link provided.] |  |
This application looks at an abstract from the 2010 AACC/ASCLS conference.The specific abstract is:
D-27 A Comparison of 3 units of POCT Analyzers applying CRP & HbA1c Reagent with the Medical Laboratory Result. K. Kusaba, M. Ono, S. Matsumoto, M. Yamaichi, H. Okada, Y. Kageyama, A. Yokogawa, T. Mori, Y. Okumura, T. Hotta, Y. Kayamori.
This study covers the following methods:- Banalyst Ace HbA1c
- AS100 Affinion
- DCA2000+
The Precision and Comparison Data
Analytical reproducibility was assessed at two levels with n=10. This study may be too optimistic, given the small sample size. Typically, Good Laboratory Practice is that study analyzes at least 2 levels of control once a day for 20 days.
| Instrument | Level (%HbA1c) |
CV% |
| Banalyst Ace |
5.1% | 1.0% |
| 7.7% | 1.1% | |
| AS100 Afinion |
5.1% | 0.9% |
| 7.8% | 1.1% | |
| DCA2000+ | 5.5% | 1.3% |
| 7.6% | 1.8% |
Note that CLSI and current guidelines for Diabetes guidelines set the minimum precision performance at 5%, with 3% as the desired performance. So performance is looking good - but because we have such a small precision study, we shouldn't celebrate until we've done a longer study.
Analytical inaccuracy was assessed using approximately 100 specimens. The comparative method was the TOSOH HLC-723G7, an HPLC method which was calibrated to a standard traceable to the IFCC standard. So this comparative method is close to a reference method.
| Instrument | n | Slope | Y-intercept | Correlation |
| Banalyst Ace |
100 | 0.992 |
0.124 | 0.997 |
| Afinion AS100 |
99 |
0.953 |
0.623 |
0.989 |
| DCA 2000+ | 99 |
0.991 | 0.358 |
0.988 |
The correlation numbers, which usually get the lion's share of the attention in a method validation study, are good for all three methods. But remember, the correlation number only tells us if linear regression is sufficient to calculate the bias. If the correlation was below 97% or so, Deming or Passing-Bablock regression would be a better method to assess inaccuracy. The abstract doesn't indicate what type of regression was used, but since the correlation is high, linear regression is fine.
Based on the slope and y-intercept alone, it's hard to know which method is more accurate. The Banalyst Ace has the highest slope. The AS100 has the lowest slope (proportional bias), but also a high y-intercept (constant bias). Thus, the two errors might cancel each other out.
To get a real idea of performance, we need to align our inaccuracy data with our imprecision data. The easiest thing to do is to calculate the bias at the levels where the imprecision was calculated, using the regression equation.
Just to review this calculation, here's a layman's explanation of the equation:
NewLevelNewMethod = (slope * OldLevelOldMethod ) +Y-intercept
Then we take the difference between the New and Old level, and convert that into a percentage value of the Old level.
Example Calculation: Given Banalyst Ace at level 5.1%, comparing to the Tosoh method:
NewLevelACE = (0.992 * 5.1) + 0.124
NewLevelACE = 5.06 + 0.124
NewLevelACE = 5.18
Difference = 5.18 - 5.1 = 0.08
Bias% = 0.08 / 5.1 = 1.63%
Now remember we have precision data for two levels - so we can use the regression equation and calculate bias for each level:
| POC HbA1c devices: summary of CV and Bias |
|||
|---|---|---|---|
| Instrument | Level | Total CV% | Bias% |
| Banalyst Ace |
5.1% | 1.0% | 1.63% |
| 7.7% | 1.1% | 0.81% | |
| Afinion AS100 | 5.1% | 0.9% | 7.52% |
| 7.8% | 1.1% | 3.29% | |
| DCA 2000+ | 5.5% | 1.3% | 5.61% |
| 7.6% | 1.8% | 3.81% | |
Determine Quality Requirements at the decision level
Now that we have our imprecision and inaccuracy data, we're almost ready to calculate our Sigma-metrics. But we're missing one key thing: the analytical quality requirement.
For HbA1c, the quality required by the test is a bit of a mystery. Despite the importance of this test, and the sheer volume of these tests being run, CLIA doesn't set a quality requirement.
| Source |
Quality Requirement
|
| CLIA PT |
No quality requirement given
|
| CAP PT 2008 |
Target value ± 12%
|
| CAP PT 2009 |
Target value ± 10%
|
| CAP PT 2010 | Target value ± 8% |
| NACB 2007 Draft |
"interassay CV<5%
(ideally <3%)" |
| Clinical Decision Interval |
Target value ± 14%
(biologically based) |
The details of these sources and quality requirements are discussed in Dr. Westgard's essay. The important thing to note here is that there is a pretty big difference between the requirements. Note also that the NACB guidelines do not specifically state any analytical quality requirement - at best, you can infer the the quality requirement based on their specifications for instrument performance. Finally, remember that while the Clinical Decision Interval quality requirement is almost the biggest number, using that number requires that the process take into account the known within-subject biological variation, which eats up a large amount of the error budget.
Given that recent studies for HbA1c have used 10% as the quality requirement, we will continue that trend.
Calculate Sigma metrics
Now all the pieces are in place. Remember, this time we have two levels, so we're going to calculate two Sigma metrics.
Remember the equation for Sigma metric is (TEa - bias) / CV.
Example calculation: for a 10% quality requirement, with Banalyst Ace compared to the Tosoh HPLC, at the level of 5.1% HbA1c, 1.0% imprecision, 1.63% bias:
(10 - 1.63) / 1.0 = 8.37 / 1.0 = 8.37
| POC HbA1c devices: summary of CV and Bias |
||||
|---|---|---|---|---|
| Instrument | Level | Total CV% | Bias% | Sigma-metric |
| Banalyst Ace |
5.1% | 1.0% | 1.63% | 8.37 |
| 7.7% | 1.1% | 0.81% | 8.35 | |
| Afinion AS100 | 5.1% | 0.9% | 7.52% | 2.76 |
| 7.8% | 1.1% | 3.29% | 6.1 | |
| DCA 2000+ | 5.5% | 1.3% | 5.61% | 3.38 |
| 7.6% | 1.8% | 3.81% | 3.44 | |
Recall that in industries outside healthcare, 3.0 Sigma is the minimum performance for routine use. In this case, we don't see any method falling below that threshhold consistently.
Again, since the precision is from a small sample, these Sigma metrics are optimistic about performance, so it's not possible to make a firm conclusion on performance until we have a longer study of imprecision. But even with a few samples, we can see differences between the methods.
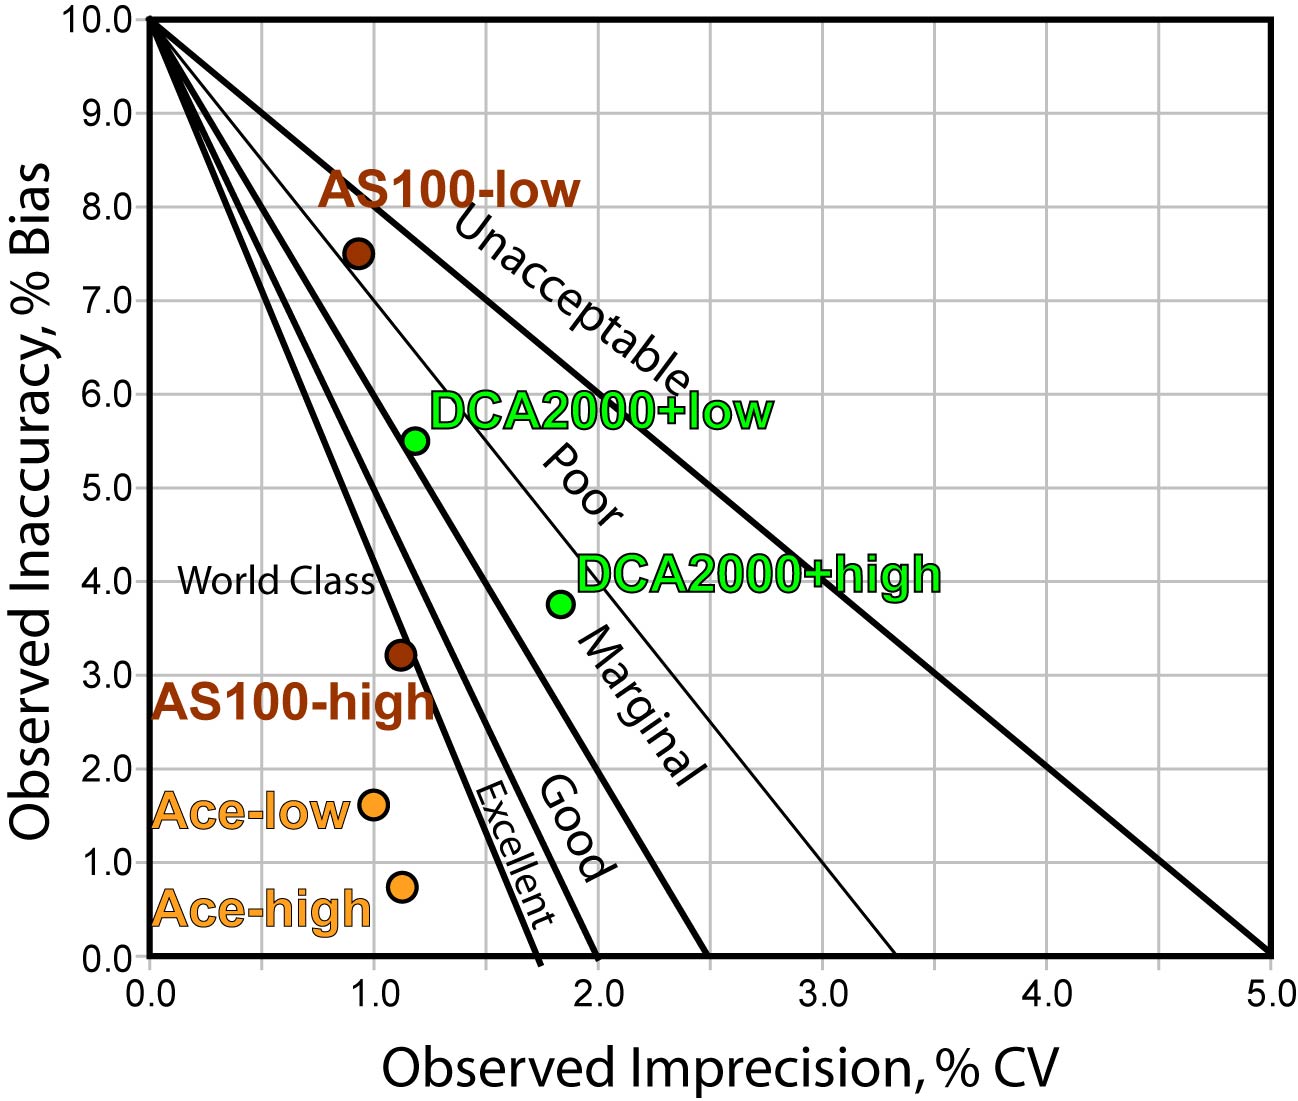
- The AS100 has a problem of bias at the lower end, despite excellent precision. At the upper end, the AS100's performance is world class.
- The DCA 2000+ has consistent performance, above the minimum standard, but it's not great.
- The Banalyst Ace has world class performance at both levels.
Summary of Performance by Sigma-metrics Method Decision Chart and OPSpecs chart
Not only can we use tools to graphically depict the performance of the method - we can use those tools to help determine the best QC procedure to use with that method.

The Method Decision chart (above) confirms that the Banalyst Ace is in the bull's eye, while the other methods are not quite as on target.
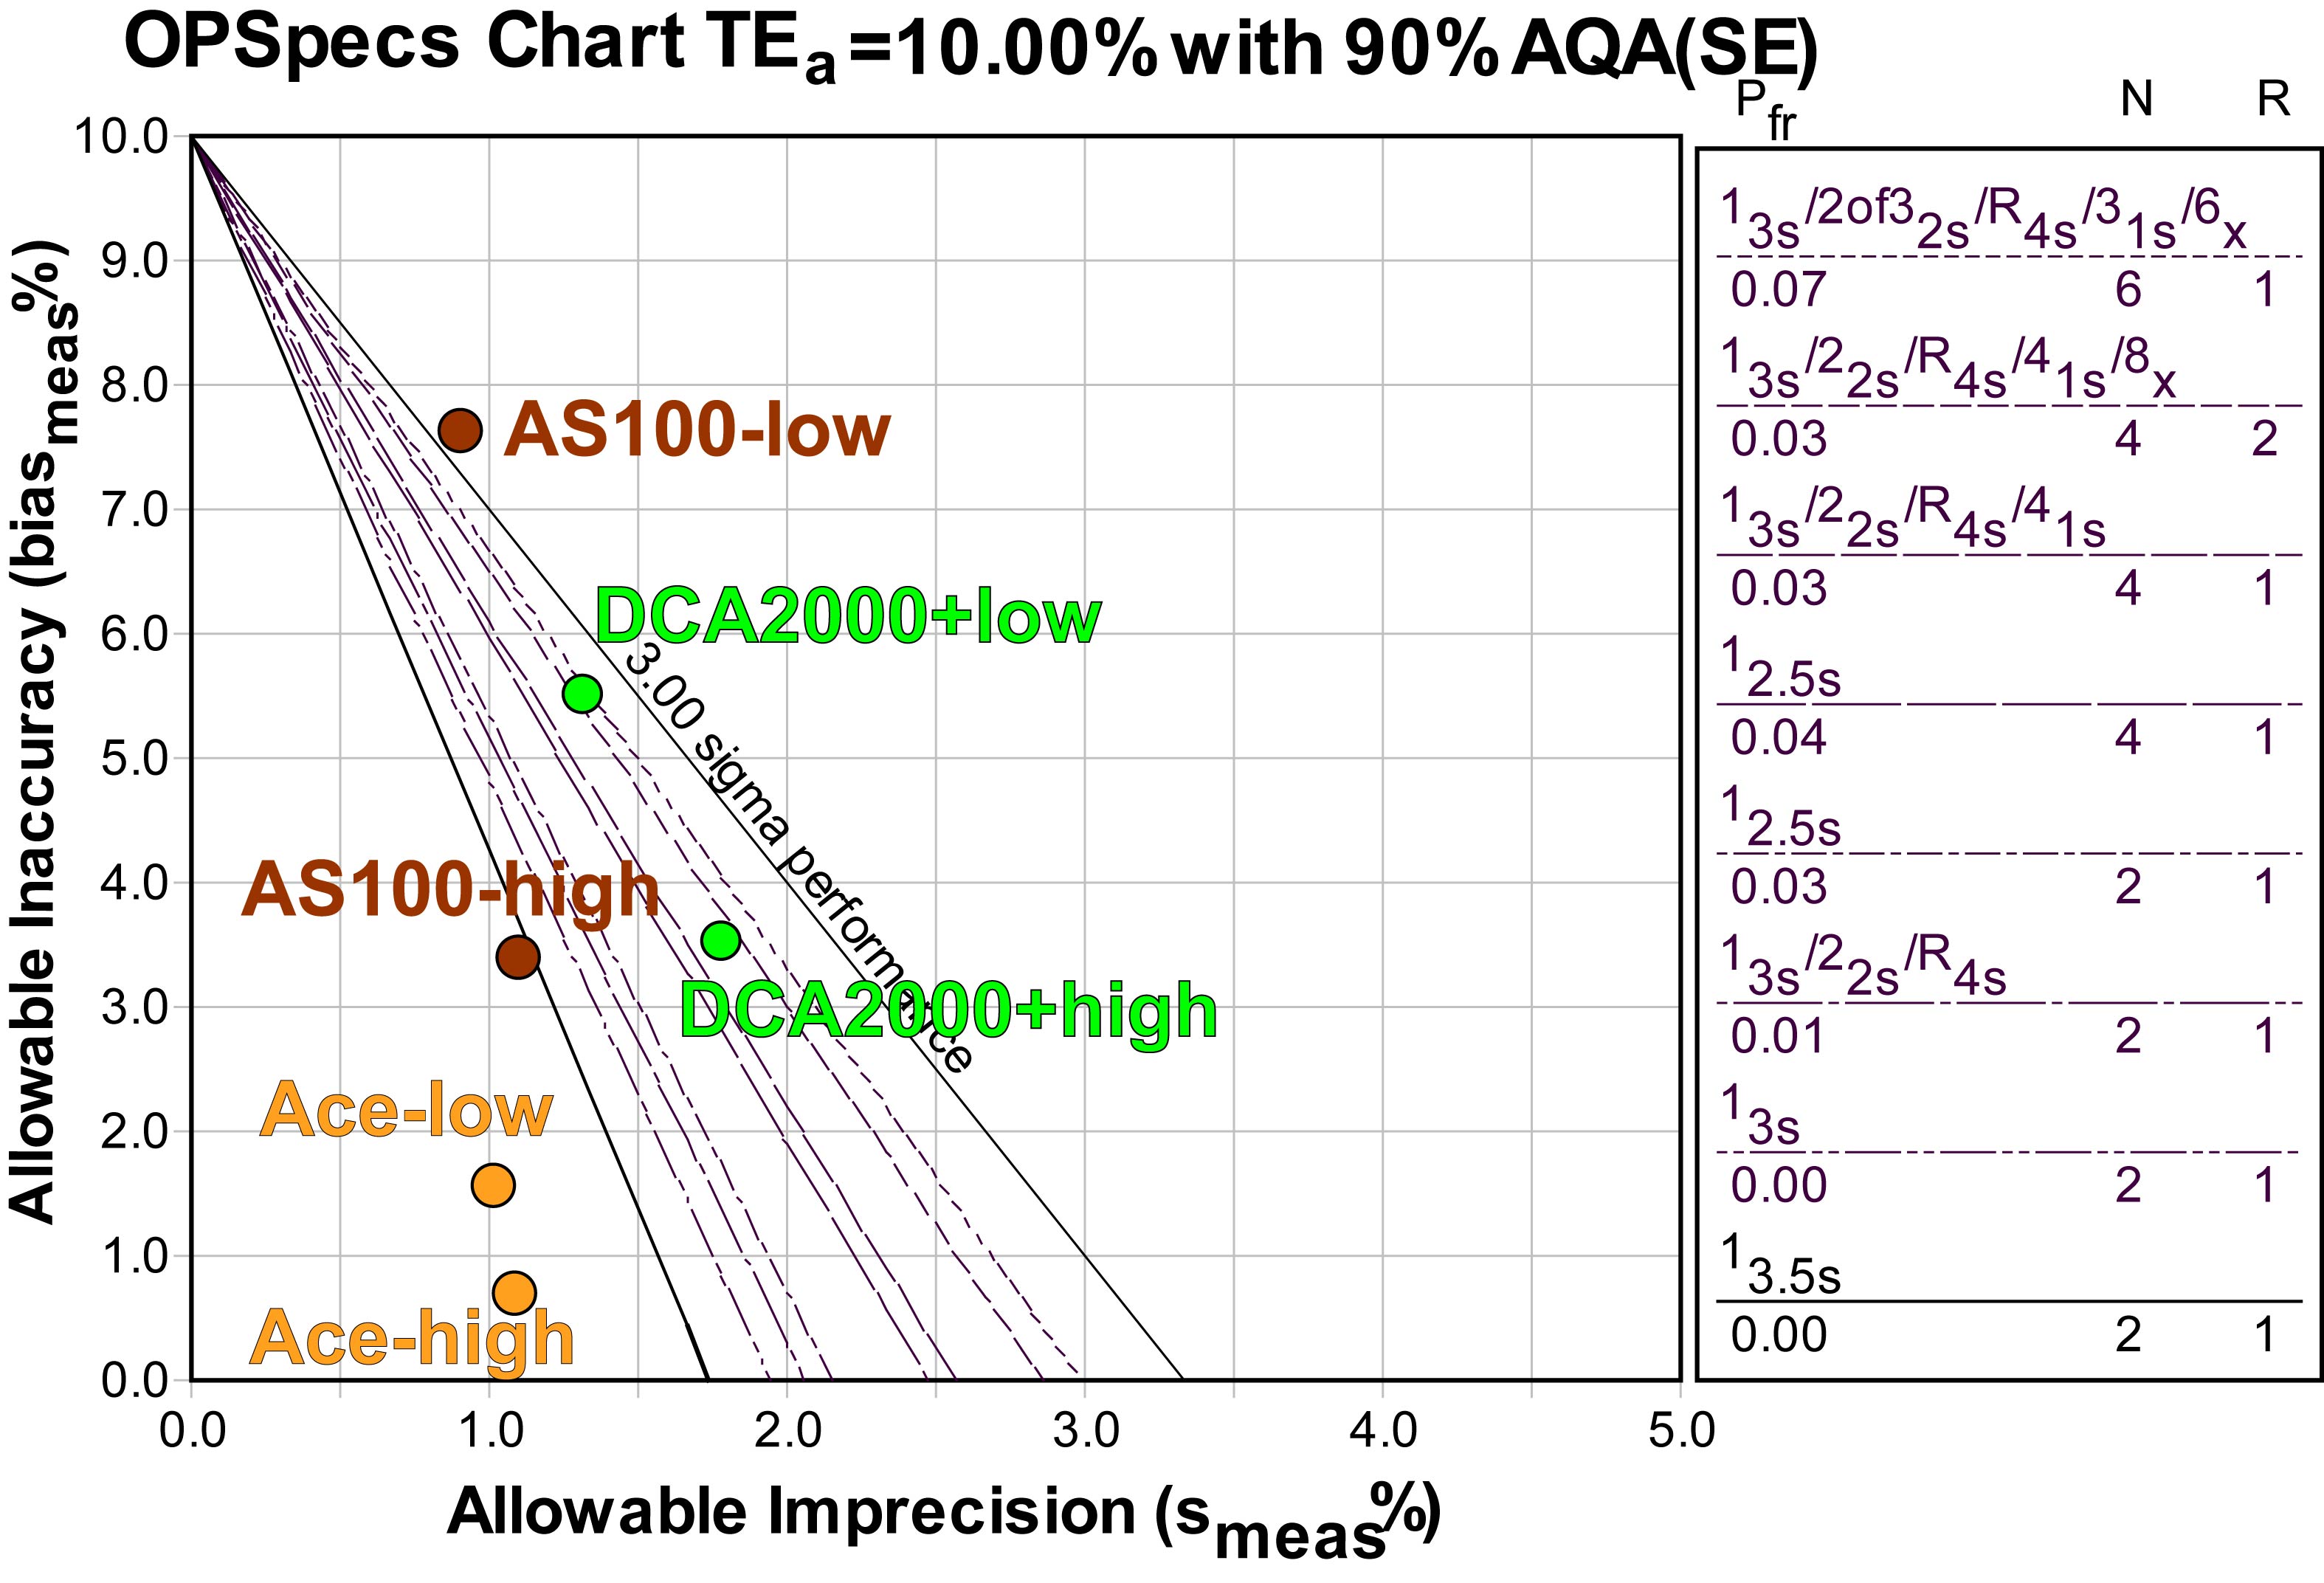
Using EZ Rules 3, we can express the method performance on an OPSpecs (Operating Specifications) chart:

If we were to base our QC decisions on this data, we could use 2 controls and 3s or 3.5s control limits for the Banalyst Ace. For the AS100, one level could be adequately controlled by 3s limits, while the other level can't be controlled with QC; we'd have to figure out a middle ground for this method. For the DCA2000+, some form of "Westgard Rules" is required, as well as 4 control measurements per run (that could be 4 separate controls, or two controls read twice in each run).
However, it would be better to get more data, particularly on precision, before making our QC Design decisions. The OPSpecs chart does allow us to estimate the impact of increased imprecisions - simply move the operating points further to the right on the x-axis. With the AS100 and DCA2000+, additional imprecision might make the methods uncontrollable (if bias is not reduced). With the Banalyst Ace, there is still some "wiggle room" in the bull's eye, so if the optimistic estimates of imprecision prove wrong, and CV's are more like 1.5%, it's still possible that performance will remain world class.
Conclusion
As you may have already guessed, with a study like this, it's important not to leap to conclusions. There appears to be good news for the Banalyst Ace instrument, but this good news is based on a very small precision study. Proper Method Validation, CLSI protocols and Good Laboratory Practice all dictate that a longer study for precision be conducted. Once we have a better picture of variation over time (a study that looks at more data points, over a longer period of time, across different days and shifts, preferably), then we can make some more reliable judgments.
