Basic QC Practices
Accentuating the Positive controls for COVID19
How should we handle positive controls in SARS-COV-2 assays? What's the upside of examining a data set that contains a real error?
Accentuating the Positive controls for SARS-COV-2 Testing
Sten Westgard, MS
November 2021
In September of 2021, we discussed negative controls for SARS-COV-2 testing.
Laboratory regulations demand that you must run QC on your tests. Even an EUA'd serology method must still run QC.
The scenario of this laboratory example is still the same: they had multiple "Westgard Rule" failures on the positive control of their SARS-COV-2 antibody test. In the data submitted to us, out of 67 control measurements made in an approximately 5 week period, 52 of them were excluded (77.6%). The laboratory was applying the complete "Westgard Rules" and recording almost constant QC violations.
Again, let us not blame the manufacturer, instrument, or reagent lot (yet). The root cause for most of these struggles lies in the ranges and structure of the Levey-Jennings chart. This goes deeper than the use or misuse of "Westgard Rules." This is about the fundamentals of building a control chart.
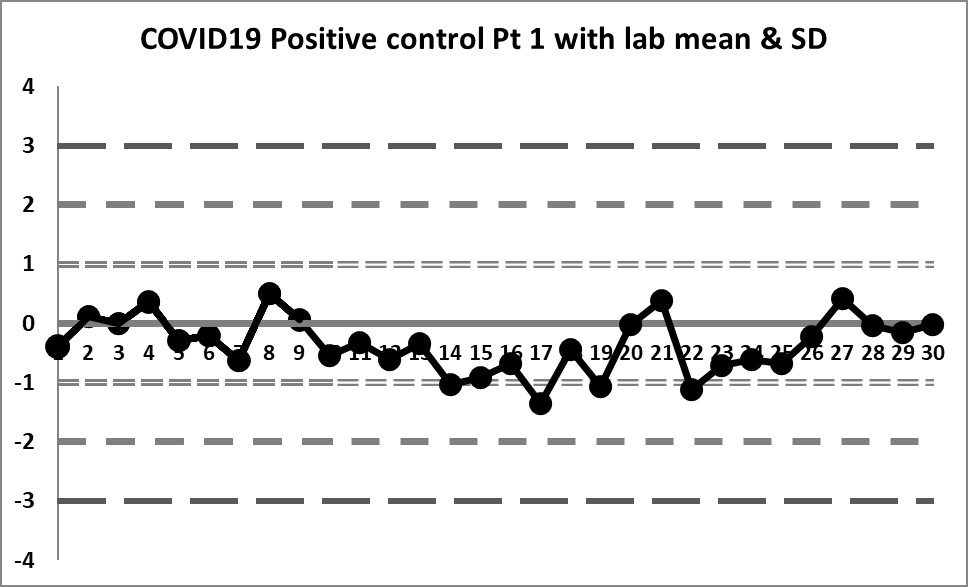
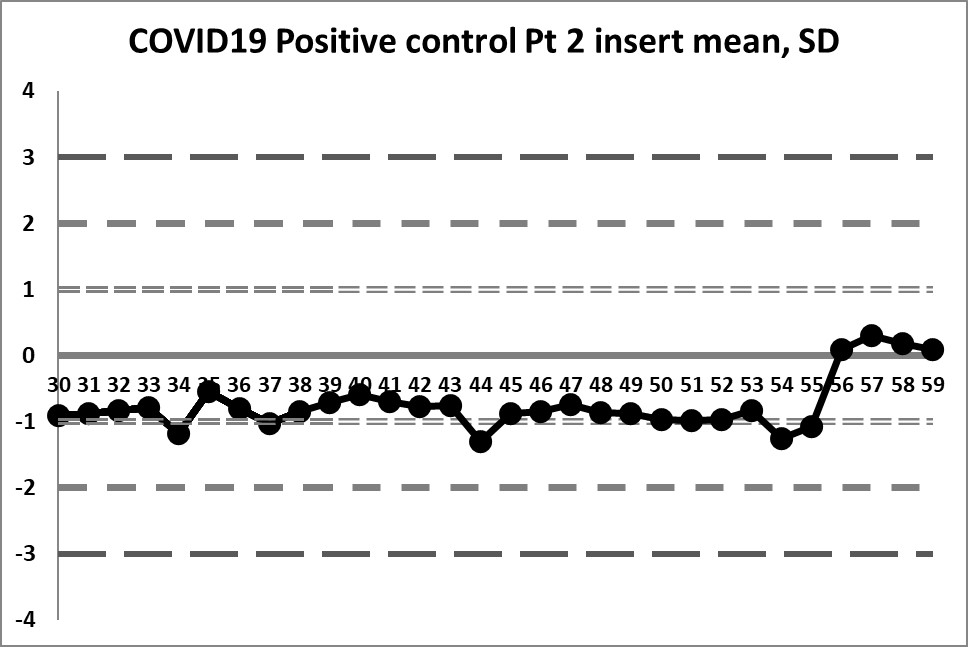
We're going to take a look at around 60 data points from July and August of 2020.
First look: The "Target" Range
The Target mean is 5.5 and the Target SD is 1.25. Using those on the LJ chart, this is what we see (30 data points per chart).
These charts are almost a flatline. The only sign of life flickers at the very end of the sequence. The target mean has almost all values below the mean. Therefore any implementation of the complete "Westgard Rules" will trigger a constant stream of 10:x errors. Only the shift above the mean near the end brings things back into "control."
Clearly this target range is not right and building the control chart this way is CAUSING errors, not catching them.
Second look: A calculated mean and SD
This next set of data is built on the actual performance of the laboratory. Running through all the data that is recorded generates a mean of 4.37 and an SD of 0.4958. It's a significant difference in mean, and a huge decrease in SD. But it doesn't solve all our problems.
So a little bit of the previous errors have been corrected - we see a little more variation, we have values both above and below the mean. And the 10:x rule is no longer being violated constantly. However, for runs 10 through 19, the 10:x rule of the "Westgard Rules" is violated. And the spread of this data is still quite tight, clustering within 1 SD mostly, until that jump at the very end.
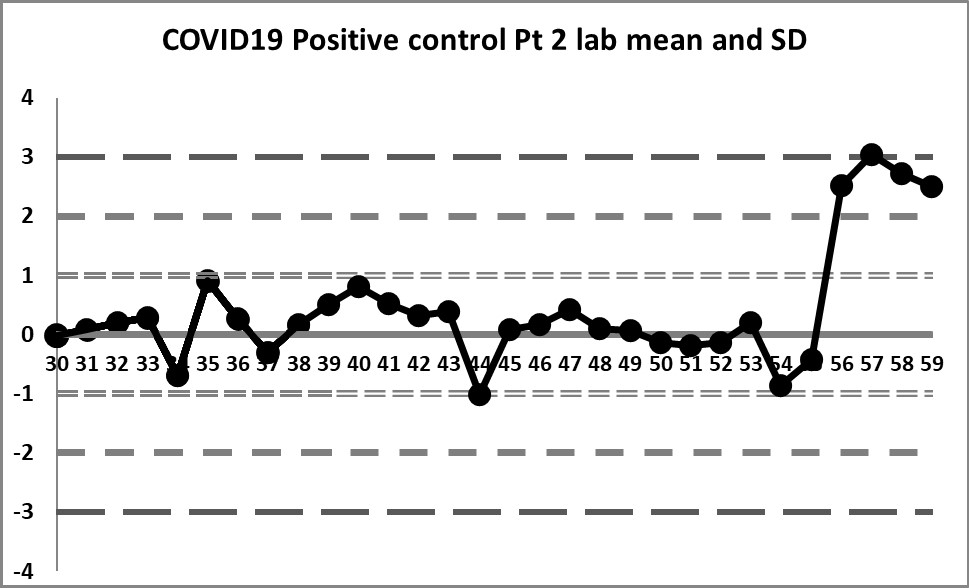
The last 4 values mark a very large shift. If the 1:2s is being implemented, either as a warning or a rejection rule, it will be set off here. There is even a violation of the 1:3s rule. Clearly, something is happening at those last four data points, possibly a change in calibration, reagent, or some kind of systemic degradataion.
Ironically, these 4 last data points were the only points that were "in" in the last set of control charts (using the package insert), while in this set of charts, they are the only points that are clearly "out".
Final look: revised and corrected mean and SD
If we focus only on the data before that significant shift, we see a different performance: our mean changes to 4.296 (lower still than the previous) and our SD changes to just 0.256 (almost half of the previous, and one-third of the package insert SD).
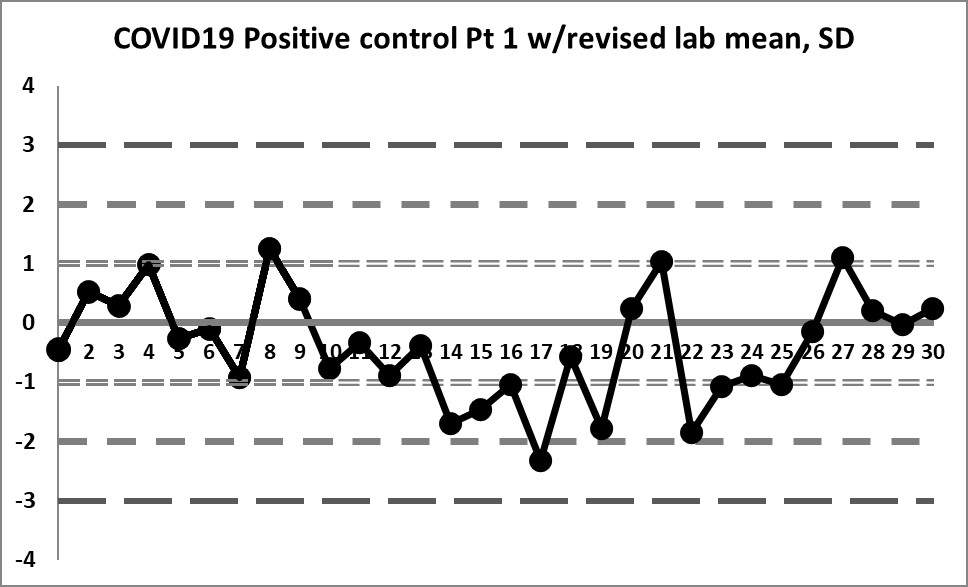
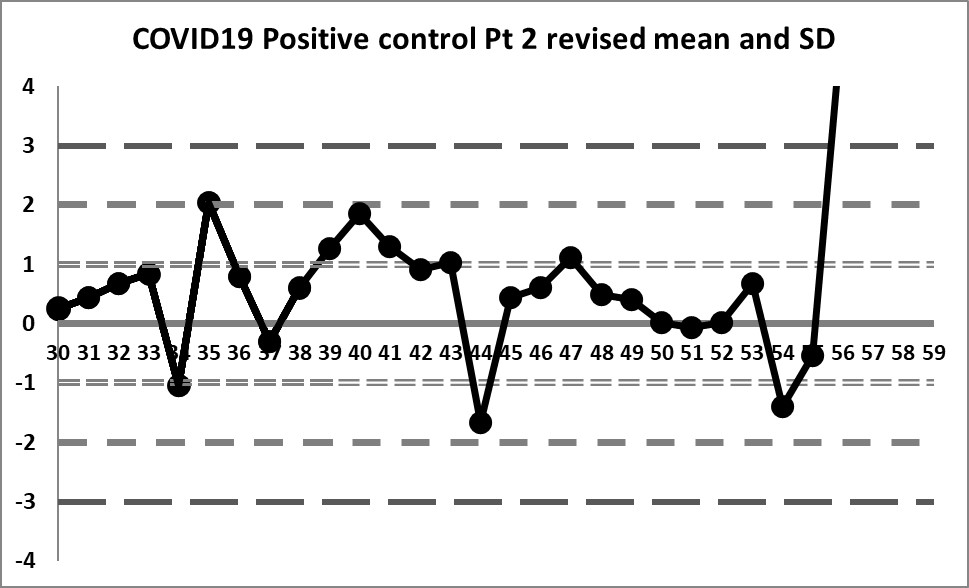
We're seeing something we haven't before: healthy variation above and below the mean. The 10:x rule violation is still there. And the last 4 values are literally "off the chart", stark proof that some kind of significant shift has occurred.
Is any of this unique to SARS-COV-2 controls?
The problems in these charts are not caused by the novelty of new SARS-COV-2 antibody assays. The problems aren't even caused by the problem of a negative control in a serology context. Once you calculate the data correctly, you can see the variation that approaches normality and you can discern problems that are real and you aren't seeing problems that are simply self-generated.
This problem of the incorrect construction of Levey-Jennings charts happens not just with SARS-COV-2 assays, not just with serology assays, not just with negative or positive controls. This is a "universal" problem across all testing areas. The temptation of a laboratory is to adopt the insert ranges or manufacturer- or vendor-supplied means and SDs. But failing to put in the work to determine your own mean and SD will bite you in the end - you will see errors that aren't real, and you will simultaneously be missing some errors that are real, but get lost in your ranges. Using the insert mean turns the good values into bad plots on the chart, and the bad values into good plots on the chart. its turns your QC literally inside-out.
Labs have to do the work. There are countless recommendations in the regulations and guidance documents and international standards. They are there for a reason.
The good news is that QC can be saved on this assay - the assay itself has some outliers but doesn't appear to be systematically in error or plagued by random errors. Appropriate adjustments to QC will help the laboratory release appropriate results and prevent erroneous results from being released.
Taking the Question one step further: What rules are necessary for a negative control?
It's worth examining another assumption in this QC scenario. The laboratory believed that applying all the "Westgard Rules" was appropriate for the positive control. Was that correct?
As many regular readers know, the most modern version of multirule QC is called the "Westgard Sigma Rules", and adjusts the number of rules to the analytical Sigma-metric. In many cases with biochemistry and immunoassay tests, the full "Westgard Rules" are now overkill. Is the same true for SARS-COV-2 antibody tests, or, for that matter, serology assays in general?
The challenge with antibody testing and any tests that use a signal-to-cutoff ratio (S/CO) is that an allowable total error has not really been specified. It's hard to know how good you're doing if you don't even have an idea of the target to hit.
In the most primitive sense, the positive control needs to stay positive. It should not cross below 1.0. If you have a positive value that falls below 1.0, that's a false negative. In most screening infectious disease applications, false negatives are the scary ones, because you tell the patient they are fine when they are not. You tell a patient they are healthy when they are infectious, they might go out and spread the disease. You tell a patient they don't have antibodies when they do, they might panic when in fact they are fine. They might sign up for another booster or vaccination shot, one that is unnecessary and now deprives the rest of the world of a truly productive vaccination.
If we take the mean of the negative control as 5.5 or 4.296, or 4.37, the distance from the mean to the 1.0 is 4.5 or 3.3 or 3.37. You can set that as a crude allowable total error. If we characterized this on the Six Sigma scale, we need to squeeze 6 SDs into this space. If we convert these distances into allowable total errors from the mean, we get values of 81.8%, 76.7%, and 77.1% (interesting to see that the TEa's are fairly close to each other, even when the means are significantly different. So if we take the revised mean and SD as the most stringent and demanding goal (76.7%), then we need to have a CV of less than 12.7% in order to achieve 6 Sigma. Luckily for us, the revised CV 5.95%. This means we have a very comfortable performance of Six Sigma. And with Six Sigma, the only rule that needs to be implemented its the 1:3s rule. So the 10:x violation, present in all charts, is not something we truly need to worry about. What we need to be able to catch are the last four values. The second of those 4 does indeed violate the 1:3s rule. But the 2:2s rule is violated here as well, and if we characterize this assay as 6 Sigma, we wouldn't implement this rule. So perhaps the TEa is a little too large. We may need to consider that a useful TEa for a positive control is not all the way down to the 1.0 mark, if it is a positive or high positive. We may need to consider TEa's that are 60-70%, not 70-80%.
Looking at both the negative and the positive controls now, it's clear that the insert ranges are not helping, and that further work needs to be invested into the practice and the design of serology QC.