Guest Essay
Dietmar Stockl, QC Reality Check, Parts One and Two
Dietmar Stockl, colleague, friend, and expert in statistics, starts a series on looking at QC data examples from the real world of the laboratory. Sometimes what happens in reality is different than what's predicted in theory.
Internal Quality Control - A Reality Check
- Part I: Setting the scene
- Part II: “Pearls on a rope”
- Part III: Purposely working with the “wrong target”
- Part IV: Purposely working with the “wrong standard deviation”
- Part V: How variable/stable do I want it?
- Part VI: How stable can I get it?
- Part VII: What’s going on? – 1
Part I: Setting the scene
Dietmar Stockl, PhD
January 2011
Remark
An analytical process has two major parts: i) the measurement procedure, which is necessary to obtain a result for a patient's sample; ii) the control procedure, which is necessary to assess the validity of a measurement result (1). This statement makes absolutely clear that IQC is a "sine-qua-non" for reporting a result. Thus, a well established IQC system is an important part of the technical competence of the laboratory.
The analytical and IQC paradigms
Analytical paradigm (2)
Analytical procedures give results that are independent from other results; the results come from a Gaussian distribution with a mean µ and a standard deviation "sigma". Analytical procedures have periods of stable performance; mean and standard deviation of the stable process can be estimated from sufficiently frequent measurements under stable conditions. However, in the course of time, analytical procedures tend to instability:
- Measured means deviate from the "true" mean due to the occurrence of systematic error
- Measured s is >"true sigma" due to increased random error
IQC can detect process deterioration (increased systematic or random error) at a sufficiently early stage:
- By repeated measurement of the same sample and investigation of the results by statistical methods (control rules)
Control rules indicate, for example, whether
- The actual mean deviates from µ and/or the actual s is > "sigma."
IQC uses a reliable estimate of µ and "sigma" for controlling the measurement process (for example, setting the control limits).
References
- Westgard JO, Barry PL. Cost-effective quality control. AACC Press, 1995.
- www.stt-consulting.com >Education >IQC book I.
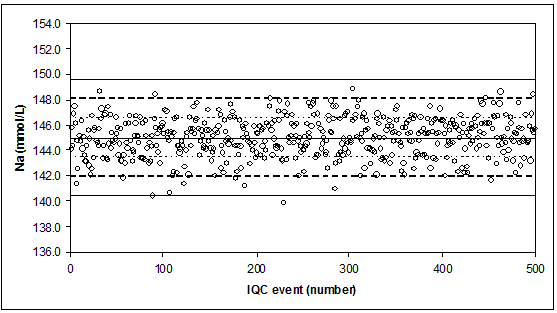
The ideal quality control situation IQC measurements of a stable control (no breakdown, evaporation, or contamination) for serum-sodium (Na, mmol/L).
Stable measurement process for Na, with “µ” = 145 mmo/L, "sigma" = 1.53 mmol/L (CV = 1.1%). Indicated are the mean, and the mean ± 1 x, 2 x, 3 x “sigma”.
Results are reported with 1 decimal.
If the control rule = 13s, we observe 1 FALSE rejection (probability = 0.27%).
Part II: “Pearls on a rope”
When the Na-results are reported without decimal, we observe “ropes of pearls”.
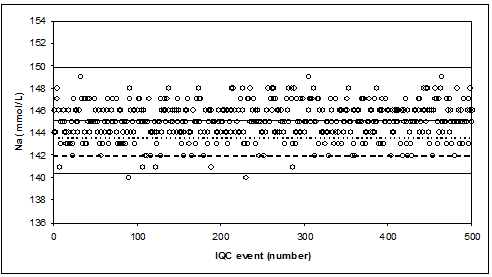
Ropes of pearls are observed when (too much) rounding does not match precision.
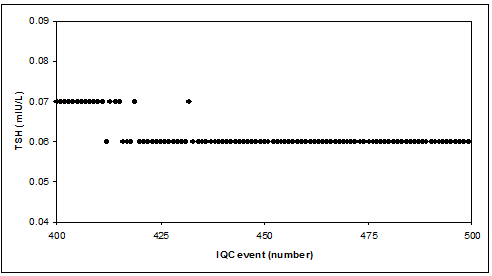
Reality check: TSH low level IQC sample
CAVE
Too few decimals (digits) may give problems with target uncertainty (rounding problem), calculation of CV (zero CV, last 50 results in TSH-example), violation of IQC rules & graphical display.
Solution
If the software allows it, use more digits/decimals for IQC purposes than you use for patient reporting