"Westgard Rules"
Power Function Graphs of Multirules
See the power functions of the different controls rules and combinations of multirules that make up the "Westgard Rule"
This article is exclusively sponsored by LGC Technopath Clinical Diagnostics

POWER FUNCTION GRAPHS
- Ns of 2 for systematic error
- Ns of 2 for random error
- Ns of 4 for systematic error
- Ns of 4 for random error
The rationale for using multirule procedures and the expected performance characteristics of Westgard rules can be shown by power function graphs. See the lesson on Power Function Graphs for more background information and a better understanding of statistical power, power curves, and power function graphs.
Ns of 2 for systematic error
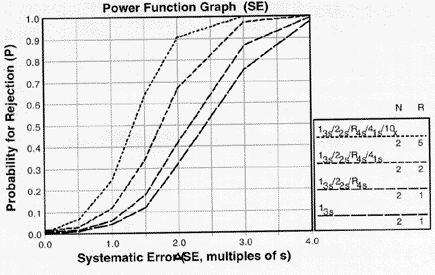
The accompanying figure shows a power function graph for systematic error, i.e., the probability of rejection on the y-axis versus the size of systematic error on the x-axis. Think of a 2s SE as a systematic shift equivalent to 2 times the SD of the method.
|
Power function graph for detection of systematic error showing effects of combinations of control rules with Ns of 2. Note that the order of lines in the graph match the order of lines shown in the key at right (i.e. the top line in the graph matches the top line of the key) |
When N=2, the error detection available from a 13s control rule is shown by the bottom power curve. The increase in power from adding the 22s and R4s rules is shown by the second curve from the bottom. Use of the 41s rule to "look-back" over two consecutive runs provides additional detection of persistent systematic errors, as shown by the next to the top curve ( for N=2, R=2). This can be further increased when the 10x is used to look-back over five consecutive runs (top curve, R=5).
Ns of 2 for random error
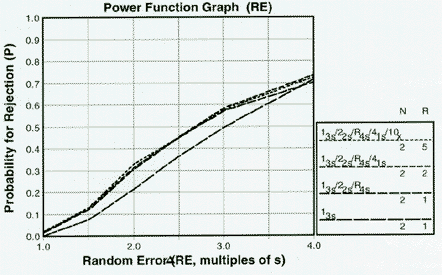
The power function for random error again shows the probability for rejection on the y-axis versus increases in random error on the x-axis. Think of an RE of 2.0 as a doubling of the SD of the method.
|
Power function graph for detection of random error showing effects of combinations of control rules with Ns of 2. |
Random error is detected mainly by the 13s and R4s rules. We have recommended that rules for random error, such as R4s, be used only within a run in order to distinguish random error from between run systematic errors (which should be detected by rules such as 41s, 10x). Therefore, the power of the multirule combinations show no further improvements in detection of random errors for across run applications; the power curves for the R-2 and R=5 combinations that use the 13s and R4s rules essentially coincide with the power curve for those rules with R=1, as shown by the top three curves on this power function graph.
Ns of 4 for systematic error
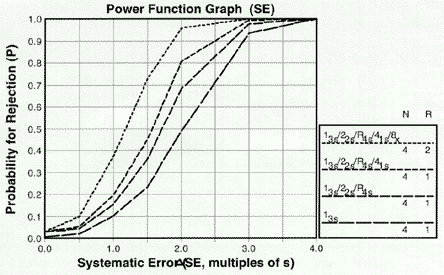
Further improvements in error detection can be expected when N is increased to 4 because the 13s, 22s, R4s, and 41s can now all be applied within the run.
|
Power function graph for detection of systematic error showing effects of combinations of control rules with Ns of 4. |
For detection of systematic errors, the original error detection of the 13s control rule is shown by the bottom power curve, the increase from addition of the 22s and R4s rules is shown by the next to bottom curve, and the increase from use of the 41s rule within run is shown by the next to top curve. Error detection across runs is increased by the use of the 8x rule to look-back over two consecutive runs (N=4, R=2).
Ns of 4 for random error
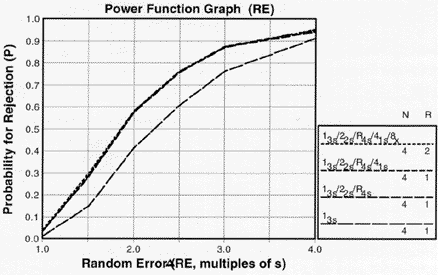
The detection of random error is again affected primarily by the 13s and R4s rules. The original error detection from the 13s rule is shown by the bottom curve and is increased by the addition of the R4s rule as shown by the top curves.
|
|
Power function graph for detection of random error showing effects of combinations of control rules with Ns of 4. |


