Sigma Metric Analysis
Multimode analysis of Atellica CH930 in Spain
Now that EFLM has gone to minimum, and CLIA has issued tighter goals for 2024, it's time to take another look at a major instrument system. Ricos 2014, EFLM minimum and desirable, CLIA 1992 and 2024. How does an Atellica stack up?
Multimode analysis of an Atellica CH 930 chemistry analyzer in Spain
August 2022
Sten Westgard, MS
A few years ago, we took a look at the Siemens Atellica. It's time to look again, using the latest performance specifications from the EFLM desirable and minimum specifications, Ricos 2014, and CLIA 1992 and CLIA 2024.
See the other analyses in this series:
- Beckman Coulter DxC 700
- Abbott Alinity
- Siemens Atellica
- Siemens Atellica in Romania
- Siemens Atellica in Spain
- Siemens ADVIA 2120i
- Roche c501 in Turkey
- Roche c501 in Saudi Arabia
- MicroLab RX-50 in India
- Roche cobas 6000 immunoassays in Turkey
- Sysmex XN 350 in India
- Mindray 7500 in China
- Mindray BS 2000M in China
This latest set of data comes from a very thorough study by University of Salamanca in Spain
The study was conducted between April 2021 using commercial control peer group software tabulations of imprecision. A 5 day study with 3 replicates per day was also conducted. Bias (trueness) "was estimated in terms of absolute relative bias by the difference between the observed mean value (OMV) , which was the average value derived from the fifteen EP10 results, and the assigned value at each QC concentration." The assigned value was derived from the peer group cumulated mean of the interlaboratory program.
The raw data of imprecision and bias
| TEST | % Bias | % CV |
| Albumin | 5.10 | 0.90 |
| Albumin | 4.00 | 1.10 |
| Albumin | 1.10 | 1.10 |
| Alk Phos | 12.9 | 5.00 |
| Alk Phos | 4.8 | 3.10 |
| Alk Phos | 5.2 | 2.60 |
| ALT | 12.2 | 3.50 |
| ALT | 10.8 | 2.30 |
| ALT | 11.4 | 2.10 |
| Amylase | 1.4 | 0.80 |
| Amylase | 1.4 | 1.00 |
| Amylase | 1.5 | 0.70 |
| AST | 11.1 | 2.70 |
| AST | 8.3 | 2.1 |
| AST | 11.4 | 2.4 |
| Direct Bilirubin | 12.6 | 3.5 |
| Direct Bilirubin | 2.9 | 5.1 |
| Direct Bilirubin | 8.9 | 4.5 |
| Total Bilirubin | 13.1 | 4.4 |
| Total Bilirubin | 12.5 | 5.3 |
| Total Bilirubin | 11.7 | 4.3 |
| Calcium | 7.6 | 13.2 |
| Calcium | 15.7 | 10.1 |
| Calcium | 14.6 | 10.0 |
| Chloride | 3.40 | 1.3 |
| Chloride | 0.90 | 0.8 |
| Chloride | 1.20 | 0.8 |
| Cholesterol | 5.40 | 4.2 |
| Cholesterol | 4.00 | 2.8 |
| Cholesterol | 2.70 | 2.3 |
| CK | 13.30 | 3.0 |
| CK | 9.30 | 2.2 |
| CK | 9.40 | 2.3 |
| Creatinine | 1.1 | 2.3 |
| Creatinine | 1.7 | 1.3 |
| Creatinine | 0.6 | 1.1 |
| GGT | 25.8 | 16.2 |
| GGT | 9.7 | 7.0 |
| GGT | 6.1 | 3.0 |
| Glucose | 1.9 | 1.3 |
| Glucose | 2.9 | 1.4 |
| Glucose | 2.4 | 1.5 |
| D-HDL | 5.3 | 2.0 |
| D-HDL | 4.5 | 2.6 |
| D-HDL | 2.5 | 2.3 |
| Iron | 2.2 | 1.4 |
| Iron | 1.9 | 0.9 |
| Iron | 2.0 | 0.9 |
| LDL | 3.60 | 1.50 |
| LDL | 4.60 | 1.00 |
| LDL | 2.80 | 0.80 |
| Lipase | 12.10 | 2.90 |
| Lipase | 4.60 | 1.50 |
| Lipase | 5.50 | 1.50 |
| Magnesium | 3.50 | 6.10 |
| Magnesium | 5.80 | 3.10 |
| Magnesium | 1.10 | 3.90 |
| Phosphorous | 5.30 | 2.20 |
| Phosphorous | 1.50 | 1.10 |
| Phosphorous | 4.30 | 1.40 |
| Potassium K | 1.20 | 1.20 |
| Potassium K | 1.10 | 0.90 |
| Potassium K | 1.00 | 0.80 |
| Protein, Total | 1.90 | 0.50 |
| Protein, Total | 1.80 | 0.70 |
| Protein, Total | 1.50 | 0.80 |
| Sodium | 1.80 | 0.80 |
| Sodium | 1.30 | 0.70 |
| Sodium | 0.70 | 0.60 |
| Triglycerides | 7.40 | 1.30 |
| Triglycerides | 5.90 | 0.60 |
| Triglycerides | 3.80 | 1.00 |
| Uric Acid | 2.60 | 1.30 |
| Uric Acid | 2.30 | 0.60 |
| Uric Acid | 1.20 | 1.00 |
| Urea Nitrogen | 7.50 | 2.00 |
| Urea Nitrogen | 6.90 | 1.10 |
| Urea Nitrogen | 5.20 | 1.00 |
There are 26 test methods and 78 control levels for our analysis (the study contained far more analytes - we are confining ourselves to the biochemistry for this article).
Now, the next thing to do is take a look at the latest (2022) EFLM performance specifications, both minimum and desirable as derived from the EuBIVAS biological variation database, as well as the desirable goals from the Ricos 2014 performance specifications; and finally the 1992 and newly announced 2024 CLIA goals.
Please note that the number of assays will vary from graph to graph, since not all assays are covered by the different performance specifications. For example, CLIA 1992 goals did not cover several analytes, therefore the graph shows fewer points. That makes the comparison slightly uneven - but it's a comparison of slightly different sizes of apples, not entirely different fruits.
Sigma-metrics according to EuBIVAS-derived desirable performance specifications
If you're looking for the hardest, toughest, tightest specifications, EFLM used to give them. The EFLM database used to calculate and display the desirable performance specifications. If those goals are used, more than half of the assay performance is located at 3 Sigma and below, while just over a third of performance is at 6 Sigma. That's the most worst and the least best in our comparison.
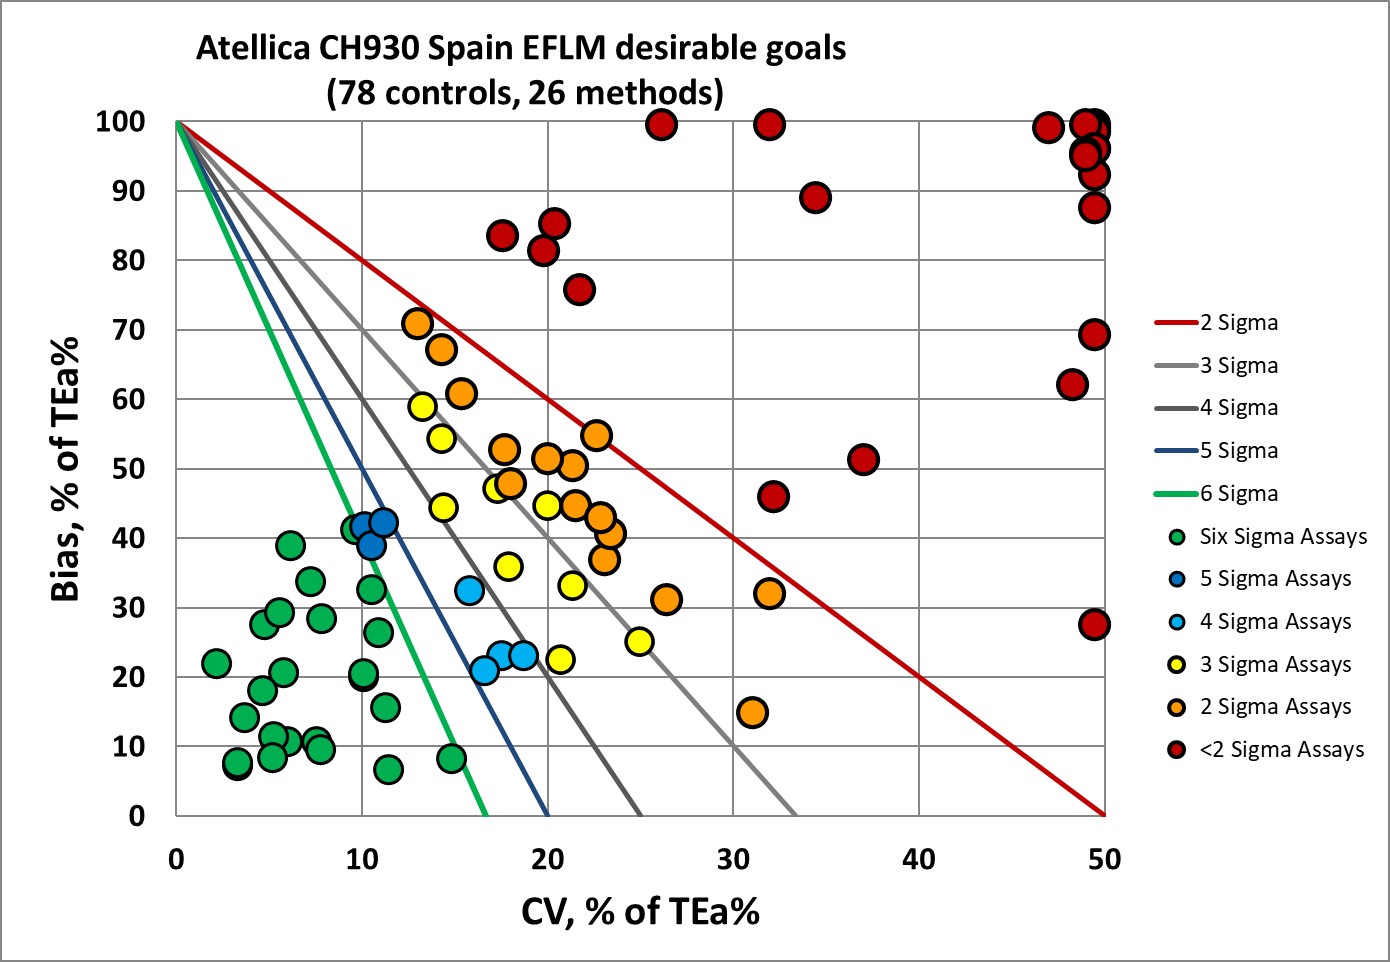
The news here is grim. We have a lot of very low Sigma metrics, nearly 50% of the values are below 3 Sigma, and in many cases we see bias and imprecision that is off the chart (which we plot along the edges of the graph). Less than a third of the assay levels reach 6 Sigma.
You can understand why the EFLM decided to switch from desirable to minimum goals. It's running away from the bad news and acknowledging the reality of today's instrument performance.
Sigma-metrics according to EuBIVAS-derived MINIMUM performance specifications
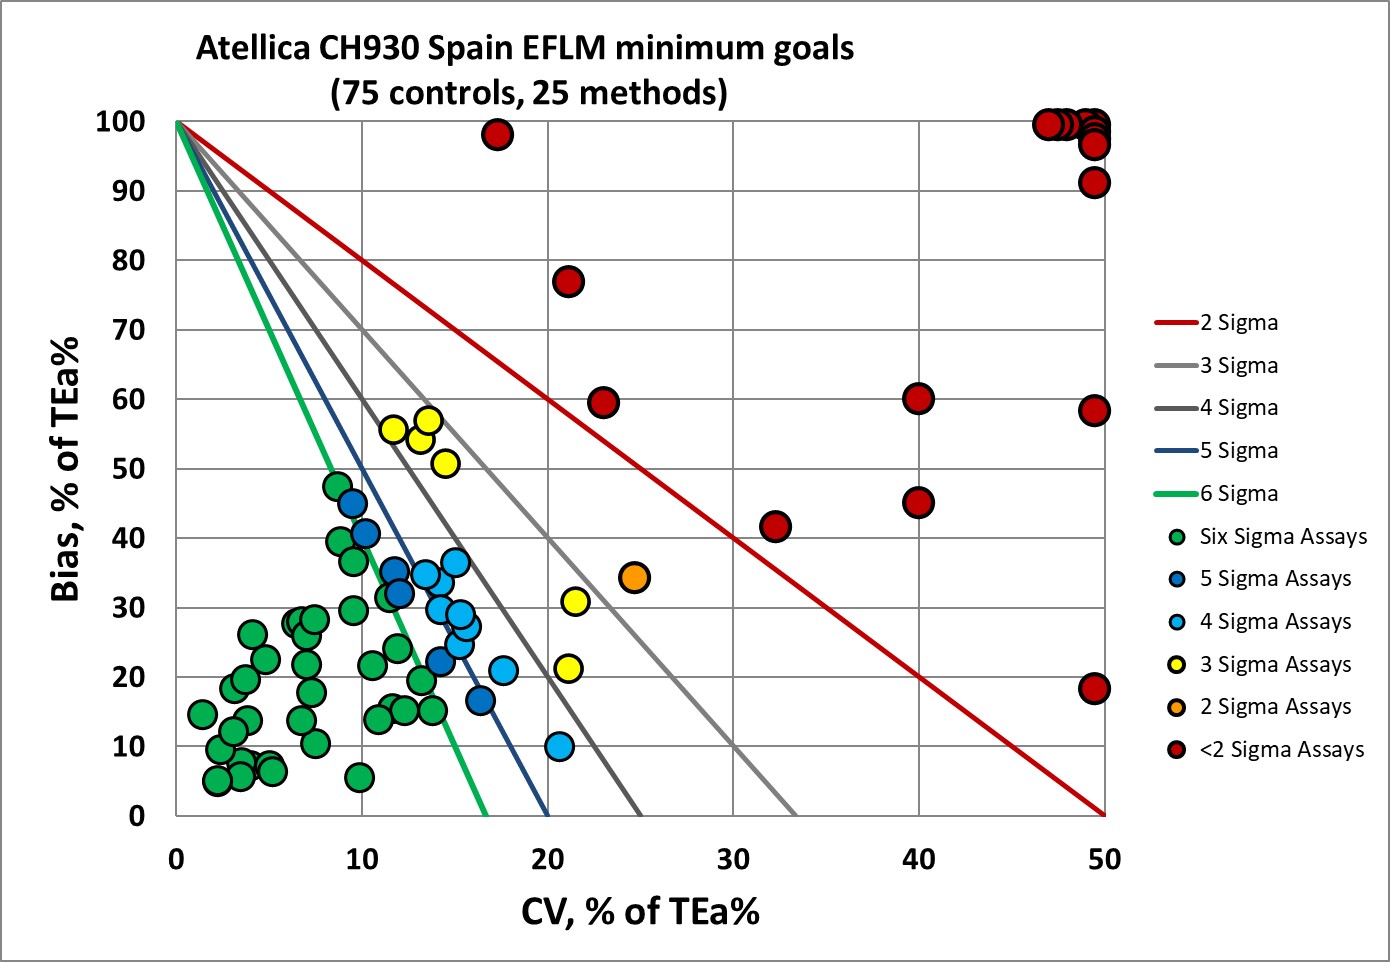
There is a big improvement, but it's not a miracle cure. The number of levels performing at 6 Sigma rises nearly to 48%, and the number of assays performing below 3 Sigma drops to 24%. But that's still 1 out of 4 levels that is below acceptability. Even the minimum specifications for calcium, chloride, and sodium are still incredibly demanding (one might say, out of reach for any instrument).
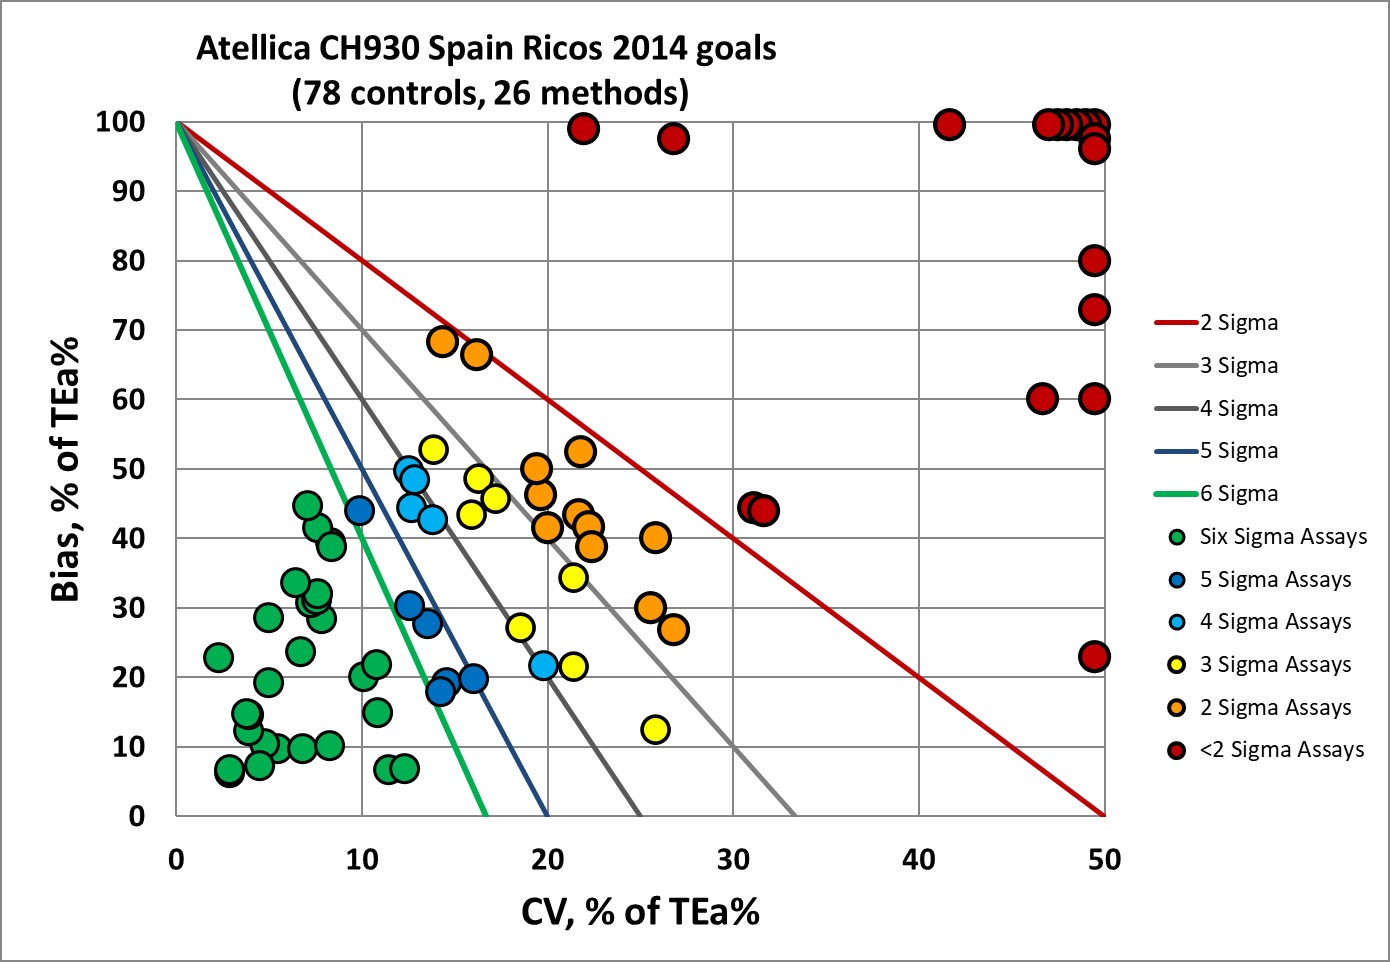
Next, let's look at the "original" version of the biological variation database. The last version of the database was updated in 2014 by Ricos et al, so we refer to these performance specifications as Ricos 2014 goals.
Sigma-metrics according to Ricos 2014 desirable performance specifications
The original Ricos goals are not quite as hard on this Atellica, but still rather tough. Almost 40% of the values are still below 3 Sigma, but the values above 6 Sigma have risen to 35%. Overall, even the goals of 2014 do not make this instrument look good.
What happens if we move away from biologically-derived goals, across the ocean over to the US, where CLIA has just announced new goals to take effect in 2024?
Sigma-metrics according to CLIA 2024 performance specifications
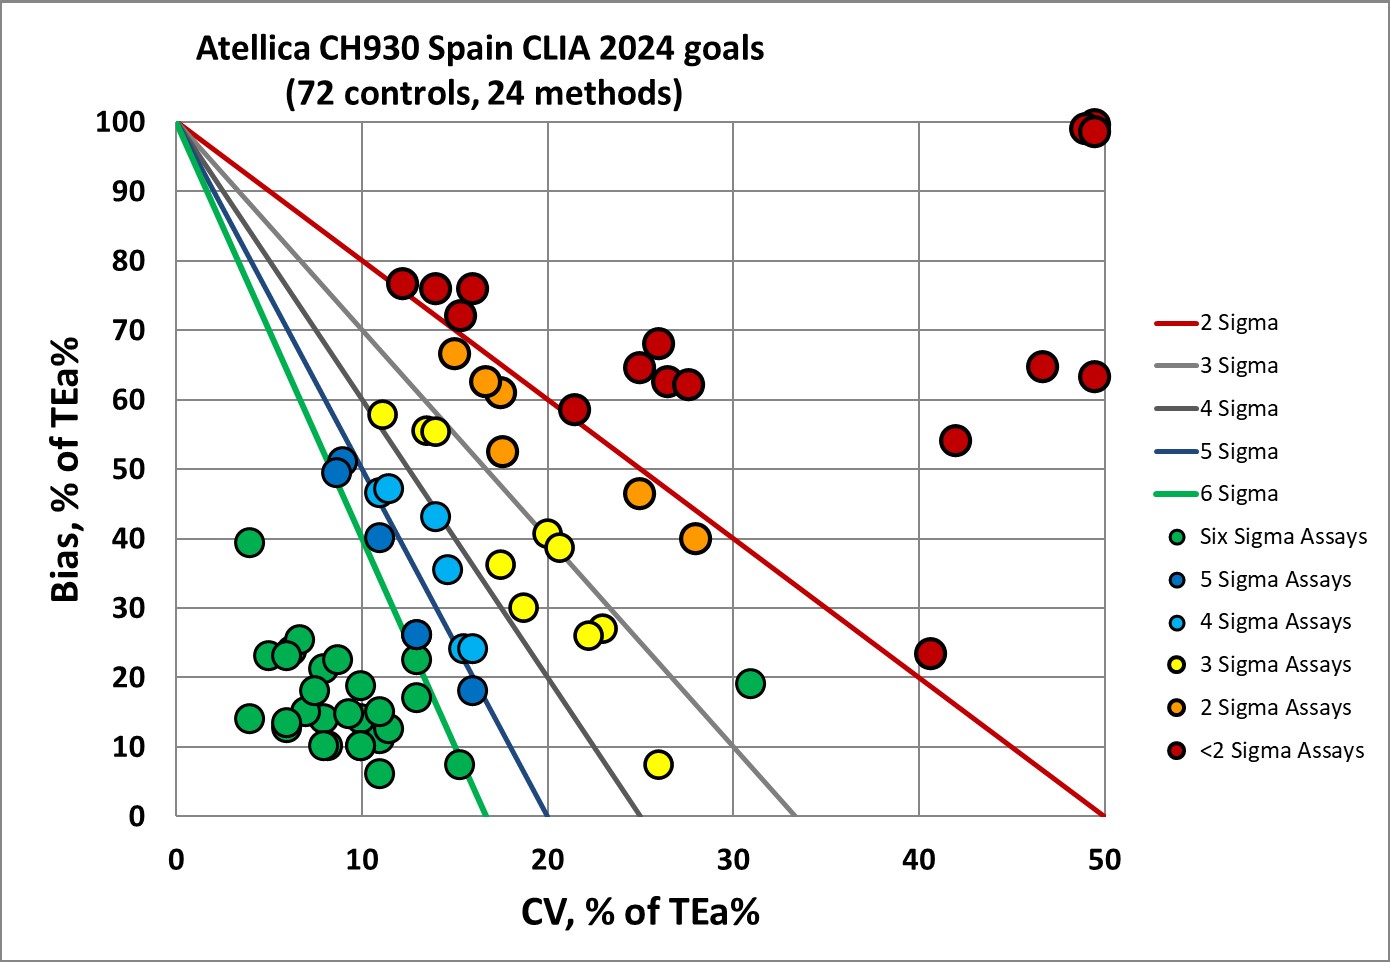
Interesting to see here that CLIA 2024 is rather similar to Ricos 2014. Just over 37% of assay performance is at 6 Sigma, and a third of the assay performance is below 3 Sigma.
Finally, let's grade these assays using the oldest set of goals, the original CLIA specifications from 1992
Sigma-metrics according to CLIA 1992 performance specifications
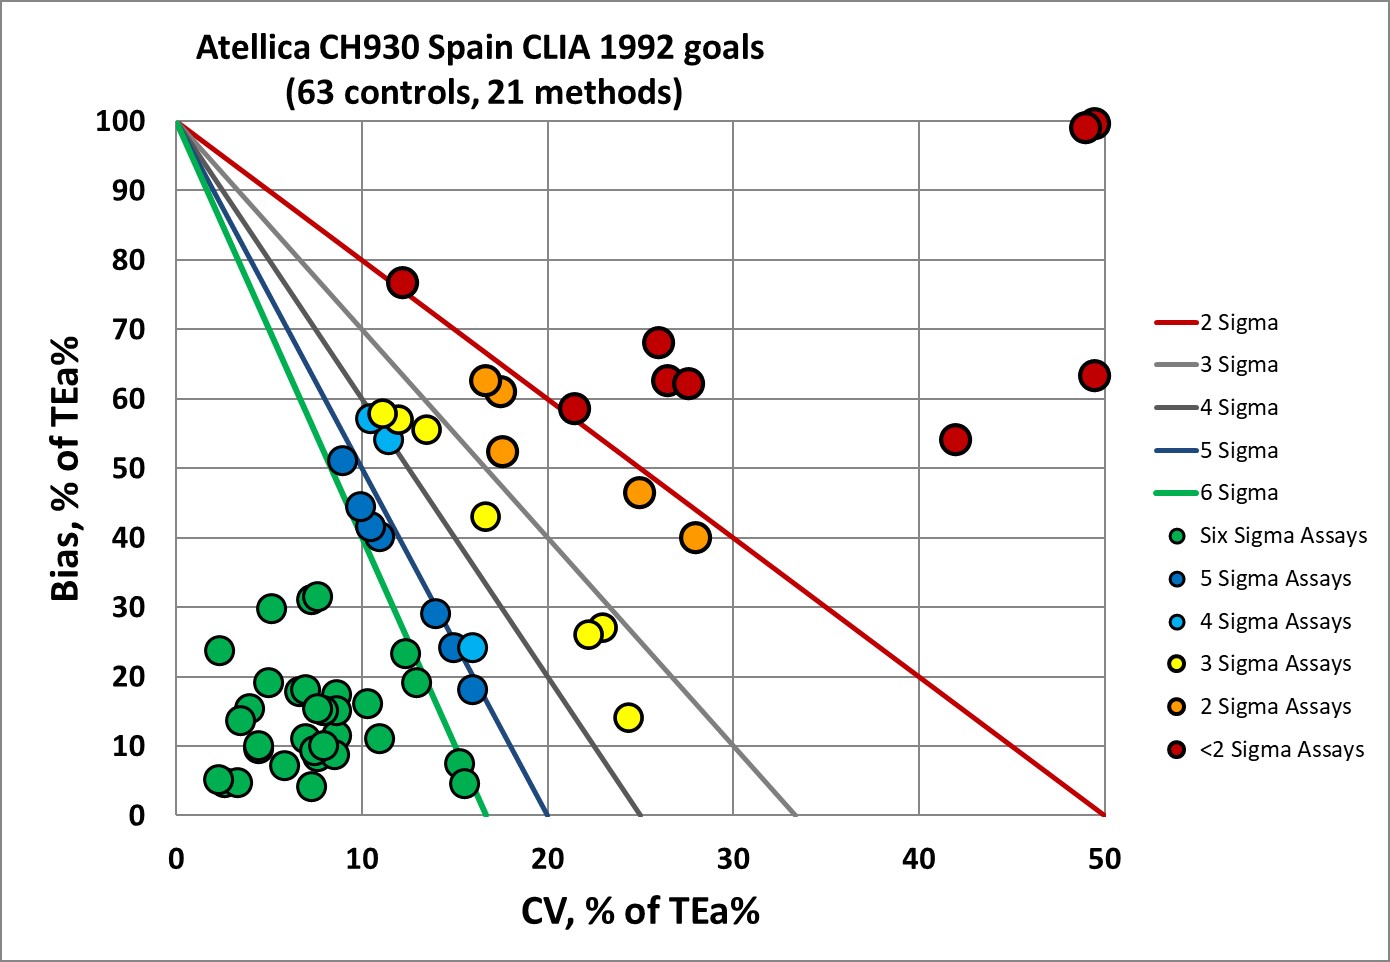
If you judge the Atellica with the oldest specifications, also the most popular ones in the USA, you finally get just over a 50% of the performance at 6 Sigma. And now only 22% of the assays below 3 Sigma.
[Please note that the CLIA goals have unit-based goals for some analytes, like sodium and calcium, so in the table we converted them a %-based goal. The study did not provide the exact levels where the control levels were run, so we had to extrapolate how the CLIA unit goals would be calculated across the normal range of the test. ]
Conclusion
If we're honest, this instrument doesn't get a great grade from any of these sets of goals. The EFLM desirable goals are still the most difficult to achieve. Applying the CLIA goals from 3 decades ago is the kindest benchmark. The new 2024 CLIA goals are pretty demanding.
This provides yet another example of the danger of adopting performance specifications out of popular enthusiasm, rather than practical capability. We need a bigger conversation about what goals are appropriate to apply to today's instruments, not just applying goals because we can calculate them. We also need to realize that the EFLM biological goals, no matter how they are calculated, whether desirable or minimal, are still out of reach for many instruments.
The optimal set of goals is not just from one source. We have to recognize that goals from outside the EFLM database are necessary.