Method Validation
An Example Linearity for Calcium
Linearity and Reportable Range are a constant task for the laboratory. Routinely completed, but often misunderstood. When is a method "linear"? What calculations have to be made? How are the results interpreted?
An Example of Calcium Linearity - what's the reportable range?
Sten Westgard, MS
February 2022
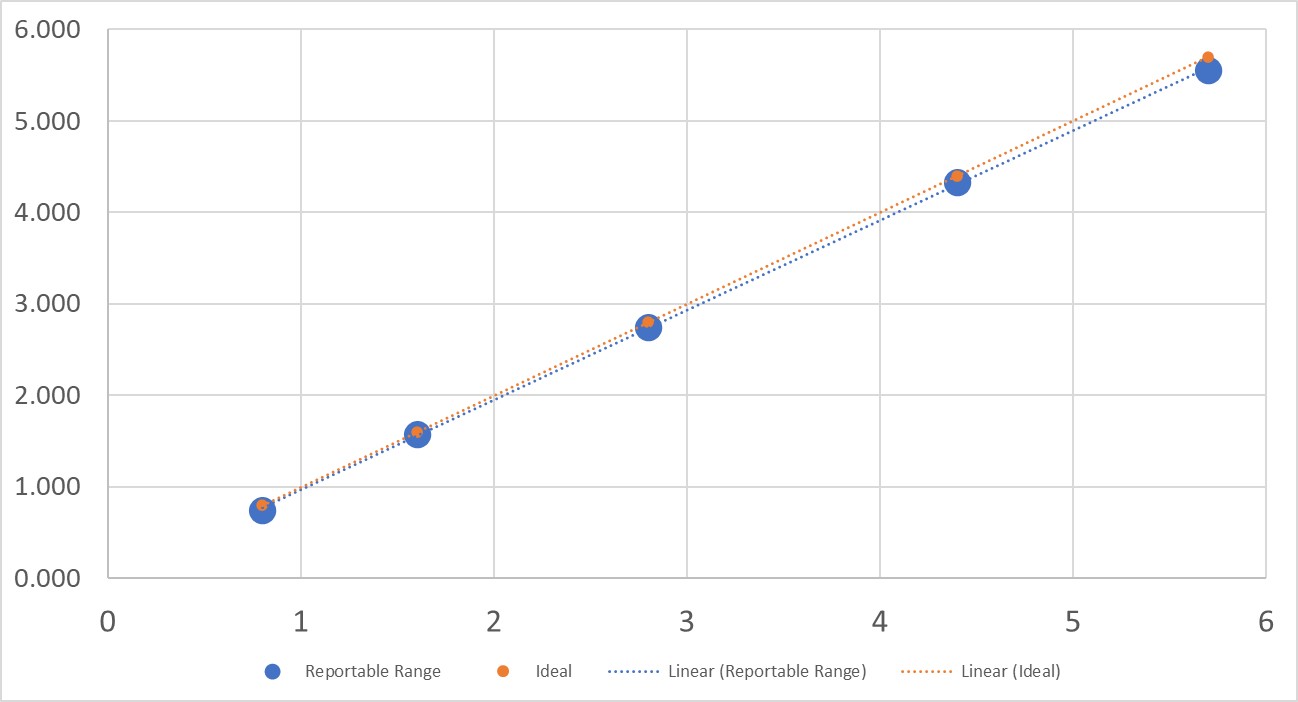
If your lab generated this Reportable Range graph for calcium (measured in mmol/L), what would be your verdict?
Perhaps you don't have an immediate judgment. You see only crude dots on a very simplified graph. Things look close, is it close enough?
So perhaps the data table would be more helpful to see:
| Level | Expected value | 1 | 2 | 3 | Average |
| 1 | 0.8 | 0.75 | 0.75 | 0.75 | 0.75 |
| 2 | 1.6 | 1.57 | 1.58 | 1.59 | 1.5 |
| 3 | 2.8 | 2.76 | 2.73 | 2.75 | 2.7 |
| 4 | 4.4 | 4.24 | 4.4 | 4.37 | 4.3 |
| 5 | 5.7 | 5.57 | 5.54 | 5.55 | 5.5 |
Perhaps even that is not enough. We can see there are differences between the average reported level and the assigned target level.
| Level | Expected value | 1 | 2 | 3 | Average | Bias% |
| 1 | 0.8 | 0.75 | 0.75 | 0.75 | 0.75 | 6.25% |
| 2 | 1.6 | 1.57 | 1.58 | 1.59 | 1.5 | 1.25% |
| 3 | 2.8 | 2.76 | 2.73 | 2.75 | 2.7 | 1.91% |
| 4 | 4.4 | 4.24 | 4.4 | 4.37 | 4.3 | 1.44% |
| 5 | 5.7 | 5.57 | 5.54 | 5.55 | 5.5 | 2.57% |
But perhaps that is not enough, either. You can see the bias percentages, but what is allowable?
Consult the consolidated table for chemistry performance specifications, and this is what you will see:
| Test or Analyte | CLIA |
2021 RIQAS |
2014 Desirable "Ricos goals" |
EFLM/ |
Rilibak | RCPA ALP | GOST 53133.1 2008 A1 (Russia) |
China WS/T 403-2012 |
| Calcium, total | ± 1.0 mg/dL | ±8.3% | ± 2.5% | ± 2.3% | ± 10% | ± 0.10 mmol/L or 4% | ± 7% | ± 5% |
So, will your decision on linearity depend on the country where you operate? Strangely, yes. You might be linear according to CLIA but unacceptable in China and Europe. That's the state of the world right now.
Even choosing the performance specification doesn't quite solve the issue. You have decide how much of the allowable total error can be consumed by the bias from linearity. Or you have to decide if you're going to calculate a confidence interval around your plotted data, and match that with the "cone of acceptable performance" around the expected values.
So do you want the answer? Tune into the Reportable Range Westgard Zoom and you'll see the answer first.