Resources
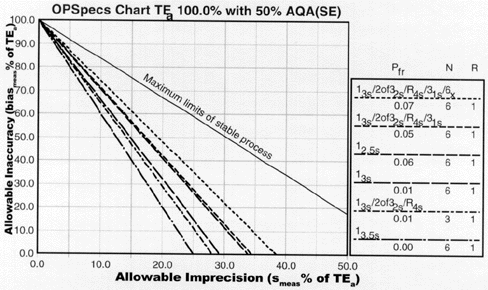
Normalized OPSpecs Chart, N=6, 50% AQA
A Normalized OPSpecs chart, displaying QC Procedures with N=6, 50% AQA.

Directions: Plot your normalized OPSpecs Chart operating point. If there are lines in the chart that lie above your operating point, they assure you the %AQA (error detection) listed in the title.
Use the Normalized OPSpecs Calculator provided to calculate your normalized operating point.
See the Normalized OPSpecs Chart Lesson for more information.
