Quality Requirements and Standards
The unbearable persistence of bias
Have we reached a point where bias in analytical methods can be solved, transformed, and/or ignored? If anything, our biases in the lab - and in the rest of the world - seem to be getting bigger...
The Unbearable Persistence of Bias
Sten Westgard, MS
September 2019
The Age of Invisible, Amplified Bias
Here at Westgard, you would think these times should make us happy. After all, this appears to be the Age of the Algorithm, where the best equation wins. Google, Facebook, all the most lucrative apps and engines succeed on the strength of their algorithms. As a company built on rules, statistics, QC and equations, Westgard QC should be in a good position to succeed as well.
But as we’ve also seen, this is the era of “fake news” and clans of internet groupthink, where the algorithms reinforce existing biases, and if anything, intensify them. Not only do these algorithms sort us into feedback loops, the algorithm itself is vulnerable to manipulation.
What you search for, and what results you see, are not as objective as you think. You may believe your search is returning unbiased results, but the algorithm is anticipating what you want and trying to feed you the most attention-getting results. Notice the goal of the algorithm isn’t to deliver the “right” answer – but to deliver the answer that will most engage your attention.
I was recently reading a book called, Data versus Democracy, by Kris Shaffer, about the concept of “Bias Amplification.” In this case, because the algorithms are seeking to deliver the most attention-getting search results, they are effectively creating a feedback loop that sorts us into distorted silos: “human biases are amplified and propagated through unchecked algorithmic content delivery.” These search results are in turn impacted by all the biases of previous similar search requests and the users who placed those requests.
Effectively, on the internet, we are all living in carefully filtered bubbles, built by algorithms, perfected by Twitter, Facebook, Amazon and Google. We are fed the news we are most likely to like, most likely to believe, and most likely to share.
In the absence of truth, bias amplification means that our personal biases are going to get bigger, not smaller, and that our beliefs are going to become more extreme, not more moderate. Algorithms accelerate polarization.
Explains some of the politics of the day, doesn’t it?
Does bias exist in the laboratory?
In laboratory medicine, bias has a much more concrete definition. There is in fact a concept of a truth, a traceability.
But recently, bias is being conflated with imprecision. That is, systematic errors are being converted into random errors, for the sake of mathematical convenience.
In the strict concepts of measurement uncertainty, biases are not supposed to exist. You have to eliminate them as soon as you discover them, in order to maintain all the other properties of the uncertainty approach. The attraction of uncertainty is that you can chain together all the uncertainties from the manufacturing process, the calibration process, down to the laboratory routine operation, and combine them into one final complete uncertainty of the testing process. If the biases exist, you can’t combine the uncertainties.
On paper, and in the scientific literature, eliminating bias has a touch of crusade to it. By advocating measurement uncertainty, a laboratory not only signals its sophistication, but also its virtue. By embracing uncertainty, the laboratory has the moral high ground to speak down to those less virtuous manufacturers who create methods that have biases.
Of course, in the real world, bias exists. Bias exists but also is not easily eliminated. Calibration, recalibration and other factor approaches can temporarily fix some biases, but other biases will come along that will further impact the method. Labs crawl between Earth and Heaven, imperfect and biased. That divergence from uncertainty theory meant few labs truly practiced or implemented measurement uncertainty in anything more than a token way (calculating it only often enough to appease inspectors).
At least, that was the case with the original uncertainty approach. But that was a previous generation of mu thinking. The latest generation of uncertainty thinking – at least one branch – has played a deft trick: turning biases into uncertainties. That is, if we can agree that a bias is actually just another uncertainty, then we can rework the math, and biases can be quickly absorbed along with all the other imprecisions of the method.
Here’s a more official description of this thinking, from the Task and Finish Group on Total Error:
“It is important to distinguish between short-term bias (e.g. within day, one shift) and long-term bias (e.g. during several weeks or months): many effects causing short-term bias, e.g. recalibrations may be seen as bias within this short time frame but may be indistinguishable from random effects when variation is observed over a longer period. When uncorrected, many short-term bias components increasingly contribute to the random error component of the MU.”
The use of error and uncertainty methods, Oosterhuis WP, Bayat H, Armbruster D, et al Clin Chem Lab Med 2018; 56(2): 209–219.
The argument is this: over the long run, all biases are really just the same as imprecision. They will vary up and down in positive and negative ways. While a bias appears in one direction in the short run, given a long enough period of time, all the biases turn out to distribute like a standard deviation.
While this solves a mathematic problem with measurement uncertainty, it again breaks apart on the shorts of laboratory reality. First, how long is the long run? As John Maynard Keynes’ famously stated, “In the long run we are all dead.” Even if we can ignore the direction of bias in the long run, in the short run, it may still be staring us in the face.
And bias, as it turns out, even over the long run, is not a random.
The unbearable persistence of bias
A simple example is available to us via the NGSP HbA1c program. This is an ideal program to check on bias, since it’s a reference-based survey of all available existing methods. So we have traceable bias. This is a long-term program, three times a year, five samples per event. There are years of data available.
So let’s look at the last 6 surveys, from 2019 back to 2017, and see what biases are revealed. That’s 30 individual events. If, over the long run, biases don’t really exist, they should, on average, balance out. The negative biases and the positive biases. If you made a simple tally of the number of negative (or positive) biases, you should come up with a number around 15. Half the time you should see positive biases, half the time you should see negative biases. The biases cancel out, therefore it’s really just another standard deviation, or uncertainty.
| Instrument | Negative Bias in GH5-C 2017 | Negative Bias in GH5-B 2018 | Negative Bias in GH5-A 2018 | Negative Bias in GH5-C 2018 | Negative Bias in GH5-A 2019 | Negative Bias in GH5-B 2019 | avg # (of 5) levels bias |
Total # (of 30) neg biases |
| Abbott ARCHITECT | 5 | 5 | 5 | 5 | 4 | 2 | 4.3 | 26 |
| Beckman AU | 3 | 3 | 2 | 2 | 2 | 5 | 2.8 | 17 |
| Beckman UniCel DxC | 0 | 1 | 0 | 4 | 1 | 4 | 1.7 | 10 |
| Bio-Rad D-10 | 0 | 1 | 0 | 1 | 3 | 0 | 0.8 | 5 |
| Bio-Rad D-100 | 5 | 5 | 5 | 4 | 5 | 5 | 4.8 | 29 |
| Bio-Rad VII | 0 | 0 | 0 | 1 | 2 | 1 | 0.7 | 4 |
| Bio-Rad VII Turbo | 1 | 2 | 2 | 1 | 2 | 1 | 1.5 | 9 |
| Bio-Rad VII Turbo 2.0 | 1 | 2 | 2 | 1 | 1 | 1 | 1.3 | 8 |
| Roche Cobas c.311 | 4 | 3 | 4 | 5 | 4 | 2 | 3.7 | 22 |
| Roche Cobas c500 | 5 | 3 | 5 | 5 | 5 | 2 | 4.2 | 25 |
| Roche Cobas c513 | 3 | 2 | 1 | 1 | 3 | 0 | 1.7 | 10 |
| Roche Cobas Integra 400 | 2 | 3 | 3 | 3 | 3 | 2 | 2.7 | 16 |
| Sebia Capillarys 2 | 5 | 5 | 5 | 3 | 5 | 4 | 4.5 | 27 |
| Siemens DCA Vantage | 0 | 2 | 0 | 1 | 2 | 4 | 1.5 | 9 |
| Siemens Dimension ExL | 2 | 3 | 2 | 1 | 2 | 2 | 2.0 | 12 |
| Tosoh G8 | 0 | 0 | 0 | 0 | 1 | 0 | 0.2 | 1 |
| Trinity Biotech Premier | 1 | 0 | 0 | 0 | 1 | 1 | 0.5 | 3 |
| Vitros 5,1, FS, 4600, 5600 | 1 | 4 | 3 | 3 | 4 | 3 | 3.0 | 18 |
The right column reports the average number of samples per event that had a negative bias. In a perfect world, where biases were only random errors, over 6 events and 30 samples, there should be around 15 total negative biases (which would mean there are about 15 positive biases to balance that out.)
That's not what we see, of course. Some instruments have a persistent negative bias (ARCHITECT, Bio-Rad D-100 [most biased], Cobas c500, Sebia Capillarys), others have a persistent positive bias (Tosoh G8 [most biased], Trinity Biotech Premier, Bio-Rad Variant II, Bio-Rad D-10) . This bias is over multiple samples, multiple events, and multiple years. Long-term, it's not disappearing. It's not indistinguishable. It's very distinct.
While this bias may exist, and is not random, there is still the case that it might not be significant. Theoretically, if a persistent bias is identified, the manufacturer should try to recalibrate or engineer the bias out of the method.
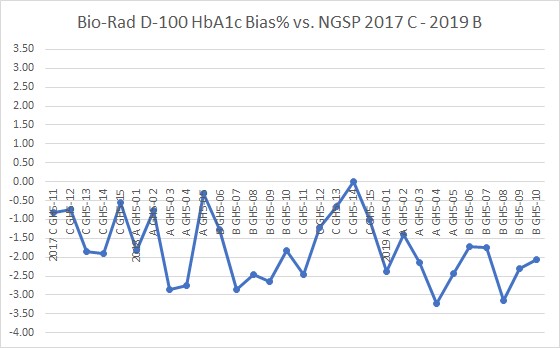
Bear in mind, 3.0% bias (in NGSP units) by itself is considered unacceptable by the IFCC committee on HbA1c standardization.
The desirable specification for bias, derived from EFLM's biological variation database of 2019, is 1.5%. Nearly half of points here fail to meet that goal. So this is not an insignificant bias present.
Therefore, this is a persistent, distinct bias we must acknowledge, account for, and manage with our QC approach.
We can't pretend it's not there, as unbearable that might be.