QC Design
Immunoassay QC with Higher N Rules
Immunoassay methods often have higher CVs than observed for routine chemistry and hematology tests. Laboratory QC practices often involve analyzing 3 or 4 different levels of controls and sometimes analyzing these controls in duplicate. In planning QC for such applications, it is useful to assess the error detection and false rejections characteristics of higher N multirule QC procedures and see how they compare with the performance from more common QC procedures having Ns of 2 to 4.
Note: at this time this was written, QC Validator was the QC Design software available. Validator has been replaced by EZ Rules 3, which has all the features and capabilities of the earlier version, as well as new enhancements.
Immunoassay methods often have higher CVs than observed for routine chemistry and hematology tests. Laboratory QC practices often involve analyzing 3 or 4 different levels of controls and sometimes analyzing these controls in duplicate. In planning QC for such applications, it is useful to assess the error detection and false rejections characteristics of higher N multirule QC procedures and see how they compare with the performance from more common QC procedures having Ns of 2 to 4. Power function graphs provide this information and provide some general guidance for selecting QC procedures for immunoassay tests.
- Do higher N multirule procedures improve QC performance?
- What higher N multirule procedures are preferred?
- Are these improvements in quality assurance worth the additional cost?
- References
- Note for QC Validator users
Do higher N multirule procedures improve QC performance?

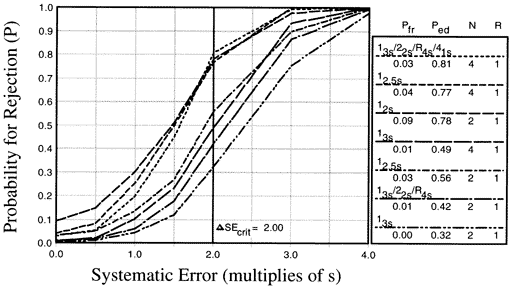
The accompanying figure shows the probabilities of rejecting runs that have different sizes of systematic errors when using common QC rules with Ns of 2 and 4. These QC procedures include the 12s, 12.5s, and 13s single rules and the 13s/22s/R4s/41s multirules with Ns of 2 and 4. If it were important to detect a 2s shift (which is shown by the vertical line), these QC procedure would provide probabilities of rejection or 0.30 to 0.80, or a 30-80% chance of error detection. The probabilities of false rejections (shown by the y-intercepts of the power curves) vary from 0.00 to 0.09, providing a 0-9% chance of rejection when method performance is stable.

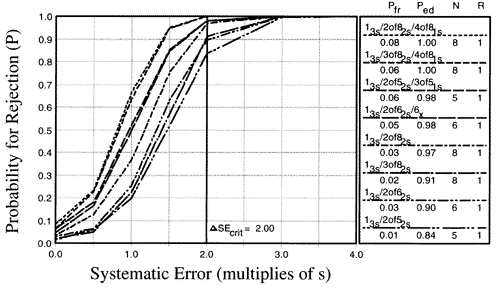
For comparison, the power curves for multirule QC procedures with Ns from 5 to 8 have been determined by computer simulation studies [1,2] and are shown here. These multirule procedures all begin with a 13s rule, followed by rules of the type MofN2s or MofN1s or Nx where M is less than N. For example, the top power curve corresponds to the 13s/2of82s/4of81s multirule procedure with N=8. A run would be rejected if any 1 control measurement exceeds a 3s limit, if any 2 of the 8 control measurements exceed the same 2s limit, or if any 4 of the 8 control measurements exceed the same 1s limit. If these higher N multirule combinations are used to detect a critical systematic error equivalent to a shift of 2.0s times the standard deviation of the method (as shown by the vertical line), the expected probabilities for error detection are from 0.084 to 1.00, i.e., if a 2.0s shift would occur, 84% to 100% of the runs will be rejected, depending on the control rules and Ns selected. The y- intercepts of these power curves show probabilities of false rejections of 0.04-0.09, i.e., 4% to 9% of the runs are expected to be rejected even when method performance is stable.
What higher N multirule procedures are preferred?
Notice that the false rejection rates of the higher N and lower N QC procedures are similar, up to 9%. However, the error detection available from the higher N multirule procedures is much greater, 84% to 100% compared to 32% to 81% for the lower N procedures. Note also that near ideal QC performance can be achieved by a relatively simple multirule procedures such as 13s/2of62s with N=6 or 13s/3of82s with N=8 (2nd and 3rd power curves from the bottom), which achieve 90-91% error detection with only 2-3% false rejections. Thus greatly improved QC performance can be achieved for the additional cost of analyzing more controls.
Are these improvements in quality assurance worth the additional cost?
This, of course, is a difficult question. The answer depends on what quality is really needed for these tests. If the clinical use and interpretation of a test would be affected by systematic shifts equivalent to 2 times the standard deviation of the measurement procedure, then it would be important to pay the price for analyzing more controls. However, if it were only important to detect shifts of 4s, the more common QC procedures with lower Ns would be fine.
Thus, the decision on how to best manage these immunoassay tests depends on the quality required for each test. Once the desired quality is defined, then a more quantitative QC planning process can be applied, as illustrated by earlier applications here. In the absense of information on the quality required, you must decide on the control rules and Ns with the objectives of keeping false rejections low and achieving as high error detection as possible. Higher N multirule procedures can maintain low false rejections and provide considerable improvements in error detection over the typical QC procedures that are commonly used in many laboratories.
References
- Haberzettl CA, Westgard JO. Allowable imprecision for analytical testing processes that utilize multirule QC procedures having 5-8 control measurements per run. Clin Chem 1995;41:S210 Abstract.
- Westgard JO, Haberzettl CA. QC for immunoassays. Diagnostic Endocrinology and Metabolism: An AACC Inservice Training & Continuing Education Program 1996;14:239- 243.
Note for QC Validator users
These higher N power curves are not presently included in the table of QC procedures in Validator 1.1 or 2.0. If you are interested in obtaining these power curves, we can provide you with a new file which simply replaces your present default.can file. Please contact us, include your name and address, and also your program registration number.
