Advanced Quality Management / Six Sigma
Secrets of Better Sigma Metrics, Part Two
As more and more papers are published about Six Sigma metrics, here are the secrets to getting better papers and better outcomes. Part 2 of a series
Six Secrets for better Sigma Metric Studies
Part Two: Don't just calculate, CHANGE.
December 2020
Sten Westgard, MS
In our first article in this series, we discussed the need for Six Sigma articles (and labs) to go beyond the evaluation of options, to get off the fence and make a choice (select the best set of TEa goals for your lab, select the best set of medical decision labs for your patients).
Once you have made the choices, you can make the changes. Implement the QC design recommendations from Sigma metrics.
In the past, let’s say from 2001 to 2015, making the changes to QC rules was a bit more involved. Either you were using Critical-Error Graphs or OPSpecs charts, and essentially you needed some software to support your implementation. We produced several versions of EZ Rules, for a time this was the only programs that could practically implement Sigma metric QC design. Today, more and more informatics programs at the instrument, lab, and peer group level implement Sigma metrics and can provide you the support you need to choose rules.
A few years ago, we also made a completely free, drastically simplified tool “Westgard Sigma Rules”
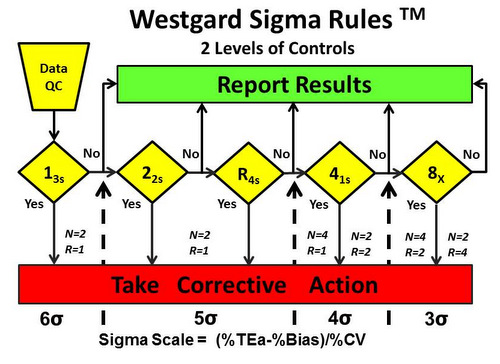
Tip 3: CHANGE your QC rules. After you find out your Sigma metrics, you should not maintain the same set of QC procedures on all your tests. That’s like buying a Ferrari and driving at 10 miles an hour. You are wasting a lot of potential if you keep the rules fixed – and even more so if you adhere to traditions of QC rules from the distant past. If you are using 2 SD control limits after calculating Sigma metrics, I don’t understand why you bothered. If you are repeating controls again and again after calculating Sigma metrics, I assume you like to hurt yourself.
The key practical benefit to the laboratory of calculating Sigma metrics is that when you find out your Sigma metrics are good, excellent, or world class, you can reduce your effort. You can run fewer “Westgard Rules” – maybe even run just one rule and dismiss them all.
[Often Unspoken, but significant: If you have a lot of low Sigma metric values, less than 3 in particular, the opposite is true. Those analytes need MORE than the Westgard Rules. Significantly more. You need to throw all the Westgard Rules, and all of your rules, and all of your neighbor's rules at this test. And you might want to think about serious improvements or maintenance to the method - or ultimately you need to replace this method with a better one.]
4. Change your QC frequency. Okay, this might be a stretch, I realize. But it is now technically possible to do this. In 2008, Curtis Parvin PhD published what should rightly be seen as a ground-breaking, earth-shattering, paradigm-shifting, breakthrough of a paper[1]. He finally achieved what labs had been yearning for (for over half a century): a scientific determination of appropriate QC frequency.
Before Parvin’s paper, essentially every choice of QC frequency (once a day, once every 8 hours, once a month(!)) was entirely arbitrary. There’s nothing scientific about basing your QC frequency on the rotational speed of planet Earth. The QC frequencies that most labs practice are more about compliance to regulations and minimum displays of effort. What’s the least we can do? Let’s do that. Once a day QC, without regard to the volume of testing, is a lazy rule of thumb.
After Parvin’s paper, you could actually determine, based on math, based on risk, based on the volume of your testing, how often to run QC. There was just one slight (actually major) problem: it was extremely complex. It involved new variables, non-trivial calculations, and an approach that was alien to most laboratories. As breakthroughs often do.
So while the Parvin approach existed, in the years following its publication, the implementation almost never happened. Labs stuck with once a day, once a shift, or (sheer lunacy) once a month.
Then just a few years ago, Yago and Alcover[2] made a breakthrough on the breakthrough – they took a complex mathematical calculation and turned it into a simple visual assessment. QC Frequency Nomograms made it simpler to determine how often to run QC.
Shortly after that, with the help of Hassan Bayat of Iran, a series of papers advanced the science until the complexity of the mathematics was almost completely encapsulated in a simplified graphic: the Sigma QC Frequency Nomogram [3-5].
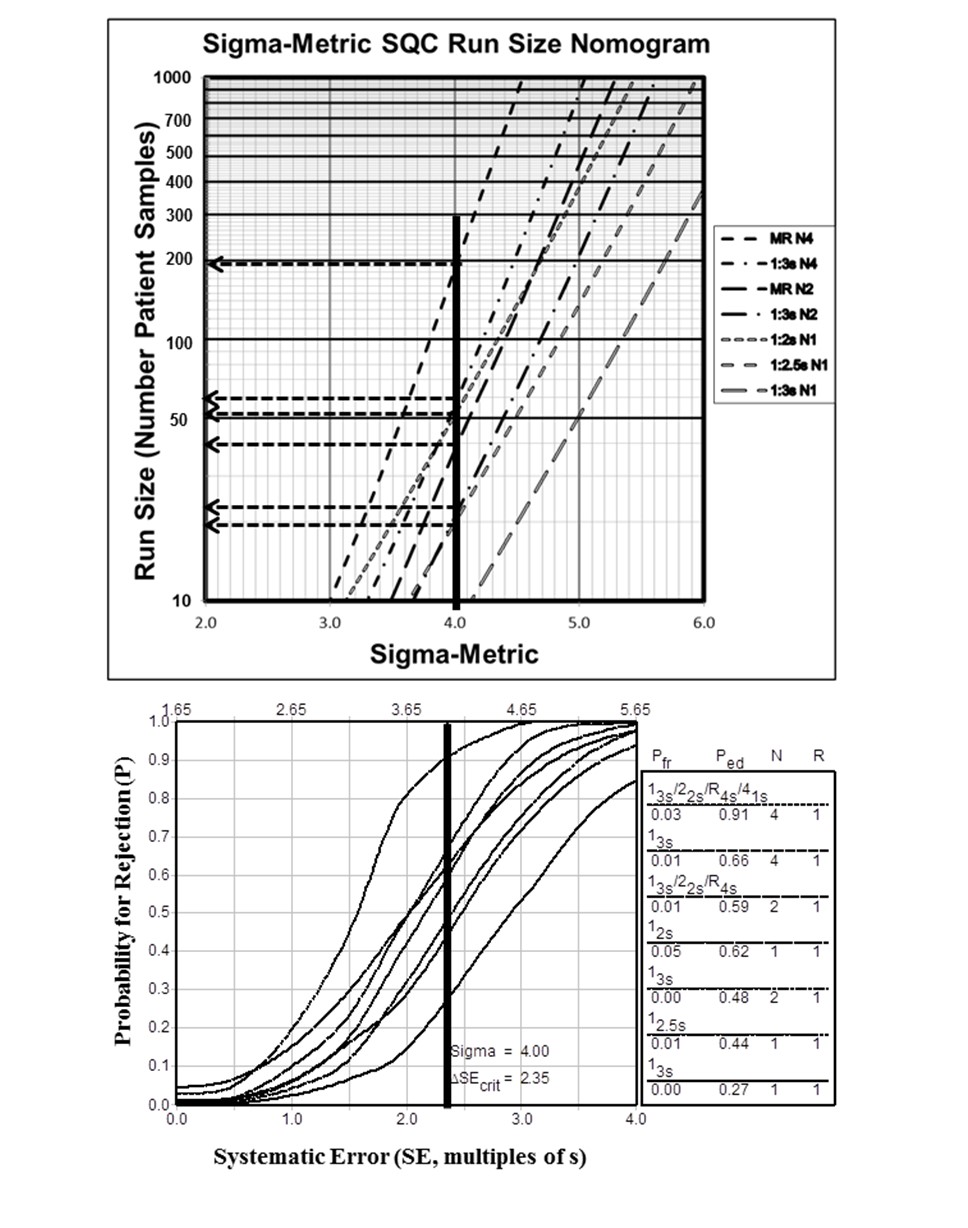
[Also pictured here, a corresponding Critical-Error graph. The two tools can be complementary.]
This tool tied your QC frequency to the Sigma metric. If you know your Sigma metric, you can also know how many patient samples (run length) you can let pass you by before you run QC again.
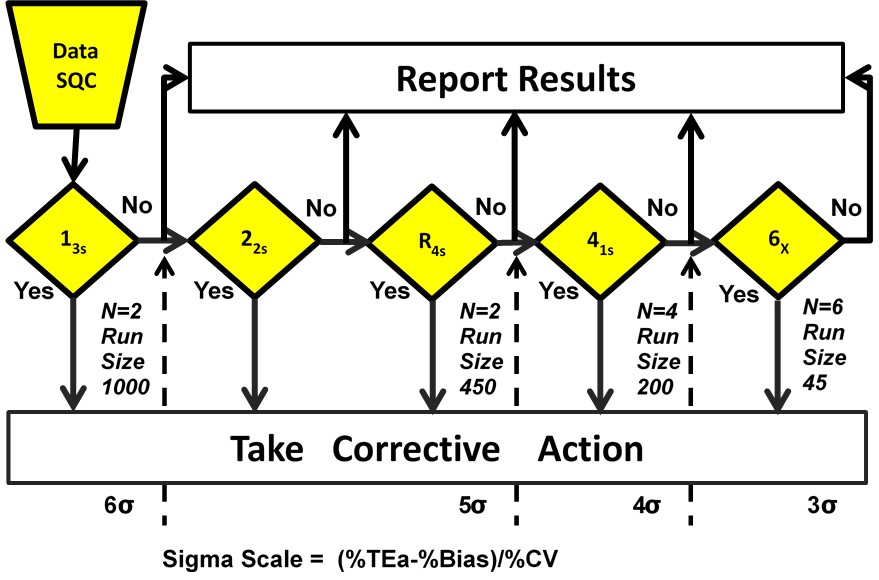
For those who didn’t want to look at a new kind of graph (the nomogram), we streamlined it further still. Now the Westgard Sigma Rules also contain the simplified patient volumes for each Sigma category. So for tests with Six Sigma, it’s possible to wait up to 1,000 patient samples before running QC again, while at 3 Sigma, you should be running QC about every 45 patient samples.
Now it’s been discovered that the ease of generating the answer (recommended QC frequency) is not the real challenge. The obstacle to optimizing QC frequency is now the control materials.
In an era of consolidation, labs find themselves with a control that might cover 40, 50, 60 analytes. If the Sigma metrics of those analytes vary considerably, what’s a lab to do. If one analyte out of 40 is at 3 Sigma, do you run QC every 45 samples (and thus causing huge overkill of QC on the analytes that are at 6 Sigma), or do you run QC every 1000 samples because you have one of those analytes at 6 Sigma (therefore woefully inadequate to the needs of a 3 Sigma analyte)? The papers on these situations are just starting to come out. There’s a lot of work ahead to find a middle ground between ideal QC frequency and the reality of the control material economics.
In a sense, what I’m admitting here is that this change is the hardest change to make reality. In a paper, it would be possible – and it would be novel – to show this determination and speculate on the most practical implementation of QC frequency for a given set of analytes and sigma metrics. Only a few papers have done this to date. In a real world laboratory, implementing the ideal QC frequency on a large number of analytes will require some professional judgment, not just mathematics and graphic tools.
But as a reviewer, if I see a paper on Sigma metrics where the authors have not only calculated Sigma metrics, they have made implementation choices on QC rules, numbers of control, and even optimal QC frequency, that is a paper that impresses. That is a paper worth publishing and worth sharing.
As a visitor to a lab, if I see a laboratory doing all these things, I place them at the highest percentile of quality achievements. That’s an elite laboratory. But I hope, one that can soon teach other labs to do the same.
References
- Parvin CA. Assessing the impact of the frequency of quality control testing on the quality of reported patient results. Clin Chem 2008;4(12):2049-54. DOI:10.1373/clinchem.2008.113639
- Selecting Statistical Procedures for Quality Control Planning Based on Risk Management Martín Yago, Silvia Alcover Clinical Chemistry, Volume 62, Issue 7, 1 July 2016, Pages 959–965, https://doi.org/10.1373/clinchem.2015.254094
- Bayat. Selecting multi-rule quality control procedures based on patient risk. Clin Chem Lab Med. 2017 Oct 26;55(11):1702-1708. DOI: 10.1515/cclm-2016-1077
- Bayat, Westgard, & Westgard. Planning Risk-Based Statistical Quality Control Strategies: Graphical Tools to Support the New Clinical and Laboratory Standards Institute C24-Ed4 Guidance Hassan Bayat, Sten A Westgard, James O Westgard The Journal of Applied Laboratory Medicine, Volume 2, Issue 2, 1 September 2017, Pages 211–221. https://doi.org/10.1373/jalm.2017.023192
- Westgard, Bayat & Westgard. Selecting a Risk-Based SQC Procedure for a HbA1c Total QC Plan. J Diabetes Sci Technol. 2018 Jul;12(4):780-785. DOI: 10.1177/1932296817729488
- Westgard, Hassan & Westgard. Planning Risk-Based SQC Schedules for Bracketed Operation of Continuous Production Analyzers Clinical Chemistry Feb 2018, 64 (2) 289-296; DOI: 10.1373/clinchem.2017.278291