Basic QC Practices
Sigma-metrics of Lab Processes, 2012
A new study looks at the frequency of errors in laboratory processes across the Total Testing Process. The study covers error rates from 2009-2011 in the University Hospital of Padua, Italy. More than a decade ago, a study in an Italian laboratory declared the primacy of pre-analytical errors. Have labs improved significantly since then?
Another look at Laboratory Error Rates, 2012
Sten Westgard, MS
JUNE 2012
Monitoring quality indicators in laboratory medicine does not automatically result in quality improvement, Laura Sciacovelli, Oswald Sonntag, Andrea Padoan, Carlo Frederico Zambon, Paolo Carraro and Mario Plebani, CCLM, Volume 50(3), Pp.463-469.
The study looked at 38 different quality indicators, many of them identified by the IFCC working group on "Laboratory Errors and Patienty Safety" (WG-LEPS). While the study concentrated on finding whether or not monitoring quality indicators actually results in improvements in those processes, the error rates themselves are quite interesting. The errors were reported as percentages, but those can easily be converted into Defects-Per-Million (DPM). Then, it's only a quick table look-up to see the Sigma-metrics of those laboratory processes. Remember when we count defects to determine Sigma-metrics, the usual number reported is the short-term Sigma.
Here's a quick summary of Sigma-metrics found in the University-Hospital of Padua in 2011:
| Laboratory Process, 2011 | Sigma-metric |
| Pre-Analytical Phase | |
| % Requests with errors in Patient ID | 5.3 |
| % Requests with missing input | 4.1 |
| % Requests with unintelligible input | 5.3 |
| % Requests with sample lost | 5.5 |
| % Samples in inappropriate containers | 5.0 |
| % Samples hemolyzed | 3.6 |
| % Samples clotted (hematology) | 4.4 |
| % Samples with insufficient volume | 5.0 |
| % Samples (anti-coag) inadequate | 3.9 |
| Analytical Phase | |
| % IQC results unacceptable | 3.8 |
| % tests not running IQC | 3.3 |
| % EQA survey results unacceptable | 3.6 |
| % EQA surveys not performed | 3.7 |
| % EQA survey errors with previous error | 3.1 |
| % tests not participating in EQA | 2.1 |
Notice any differences in the Sigma-metrics of the total testing phases? Admittedly, this table is not the full selection of all the quality indicators listed in the study. But in this particular sample, the pre-analytical error rates are about an average of 4.6 Sigma, while the average of the analytical error rates is about 3.3 Sigma. Clearly, there are some problems in the analytical phase, despite the conventional wisdom that we've solved analytical problems and we should only pay attention to the pre-analytical phase of testing.
In case the table isn't convincing, here's a graphic display of the Sigma-metrics:
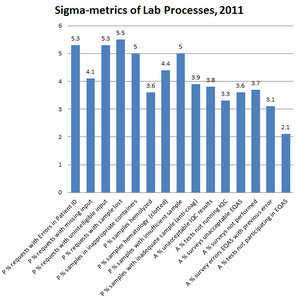
On the left, all those processes that are pre-analytical have P listed below. On the right, where you see the processes preceded by an A, those are the analytical processes. Visually, it's hard to ignore a drop-off in quality in the analytical phase of testing.
The good news is that there is a lot of good performance in the pre-analytical phase. Almost all error rates for the total testing process are above three sigma, considered the minimum acceptable level of performance. The focus of the last decade+ of the literature has paid off, improving pre-analytical processes to an excellent level of performance. Compare these rates to earlier studies of laboratory error rates. The bad news is that the analytical phase continues to be a problem. We need to make sure we're not exclusively paying attention to the pre-analytical phase with our efforts.
In this case, one of the biggest error rates is simply the number of tests where IQC isn't being performed (3.3 Sigma)and where tests are not participating in EQA surveys 2.1 Sigma). In this case, the laboratory needs to start these tasks simply to be able to determine what the level of quality is for those tests. It's hard to know what needs to be improved if you're not monitoring the quality.
Again, this is a great study full of lots of crucial facts on the laboratory testing process:
Monitoring quality indicators in laboratory medicine does not automatically result in quality improvement, Laura Sciacovelli, Oswald Sonntag, Andrea Padoan, Carlo Frederico Zambon, Paolo Carraro and Mario Plebani, CCLM, Volume 50(3), Pp.463-469.