Sigma Metric Analysis
VITROS 5600 assays in India, before and after lockdown, Multimode analysis
What happened to laboratory quality during the pandemic? There's what we suspect, and what we can actually quantify. A laboratory in India made the ultimate assessment: they collected data on their VITROS 5600 both before and during their COVID lockdown. The results are serious. Looking through the lens of EFLM and CLIA goals, it's even more serious.
VITROS 5600 assays in India, before and during lockdown, multimode analysis
December 2022
Sten Westgard, MS
The pandemic and lockdowns took a toll on laboratories all over the world. We know that, but we have only been counting up the toll on things like staff morale, staff retention and retirement, hours worked, turnaround time, and other easily trackable metrics. But how were the actual test results impacted? There's a lot less evidence for that. Perhaps there's some wilful ignorance at play - we don't want to know - or laboratories are just trying to put it all behind them now.
See the other analyses in this series:
- Beckman Coulter DxC 700
- Abbott Alinity
- Siemens Atellica
- Siemens Atellica in Romania
- Siemens Atellica in Spain
- Siemens ADVIA 2120i
- Roche c501 in Turkey
- Roche c501 in Saudi Arabia
- MicroLab RX-50 in India
- Roche cobas 6000 immunoassays in Turkey
- Sysmex XN 350 in India
- Mindray 7500 in China
- Mindray BS 2000M in China
This VITROS 5600 biochemistry data comes from Yenepoya Medical College and Hospital, Deralakatte, Mangalore, India.
A comparative evaluation of six sigma metrics and quality goal index ratio 3 months prior to first lockdown due to COVID-19 pandemic and 3 months during lockdown in a NABL accredited central laboratory, Shirin Sulthana PK, Raghavendra U, Shaheena Yassir, Ganesh Prasad V, Mohammed Ansar, Biomedicine 2022; 42(5): 1051-1057.
The study was conducted with IQC data from 3 months prior to the first lockdown due to the COVID-19 pandemic and 3 months during the first lockdown. Significantly, during the lockdown the laboratory was operating at 50% staff.
"Internal quality control (IQC) data of 10 analytes were analyzed retrospectively over 6 months, i.e. 3 months (January 2020-March 2020) prior to lockdown due to COVID-19 pandemic and 3 months (April 2020-June 2020) during the lockdown with VITROS 5600."
Bias was obtained from Bio-Rad EQAS from the same time period. Averages were calculated - thus there is one y-variable for every two x-variables. That is, for the two levels of control performance, there is only one estimate of bias. We're also going to narrow the focus of the Sigma-metrics to 7 biochemistry assays, as seen below:
| VITROS 5600 INDIA BEFORE LOCKDOWN | % Bias | CV |
| Alk Phos | 3.640 | 3.300 |
| Alk Phos | 3.640 | 2.960 |
| ALT | 2.870 | 3.400 |
| ALT | 2.870 | 3.300 |
| AST | 0.780 | 1.900 |
| AST | 0.780 | 2.460 |
| Cholesterol | 4.550 | 1.260 |
| Cholesterol | 4.550 | 1.200 |
| Creatinine | 2.065 | 2.200 |
| Creatinine | 2.065 | 1.600 |
| Glucose | 1.370 | 1.360 |
| Glucose | 1.370 | 1.700 |
| Urea Nitrogen | 0.434 | 3.960 |
| Urea Nitrogen | 0.434 | 1.630 |
| VITROS 5600 INDIA AFTER LOCKDOWN | % Bias | CV |
| Alk Phos | 7.380 | 3.930 |
| Alk Phos | 7.380 | 2.600 |
| ALT | 6.670 | 4.830 |
| ALT | 6.670 | 2.960 |
| AST | 2.790 | 3.460 |
| AST | 2.790 | 2.660 |
| Cholesterol | 2.760 | 1.730 |
| Cholesterol | 2.760 | 1.600 |
| Creatinine | 1.700 | 3.260 |
| Creatinine | 1.700 | 2.860 |
| Glucose | 5.520 | 1.360 |
| Glucose | 5.520 | 1.330 |
| Urea Nitrogen | 3.340 | 3.630 |
| Urea Nitrogen | 3.340 | 2.360 |
Even a cursory glance tells us that the imprecision and bias rose significantly during the lockdown. It shouldn't be surprising that the stress of a lockdown impacts the laboratory, but trying to figure out the size of the impact has been a mystery.
This analysis will use the performance specifications from latest (2022) EFLM, both minimum and desirable as derived from the EuBIVAS biological variation database (accessed November 2022), as well as the desirable goals from the Ricos 2014 performance specifications; and finally the 1992 and newly announced 2024 CLIA goals.
For the sake of simplicity, rather than show two graphs of every performance specification set (which would be 10 graphs, let's admit that's more than even a Westgard likes to stare at), we'll focus on the graphs for CLIA 2024 and EFLM minimum.
Sigma-metrics according to EuBIVAS-derived DESIRABLE performance specifications (after Lockdown)
The EFLM desirable specifications used to be the global standard, but have fallen out of favor due to their toughness.
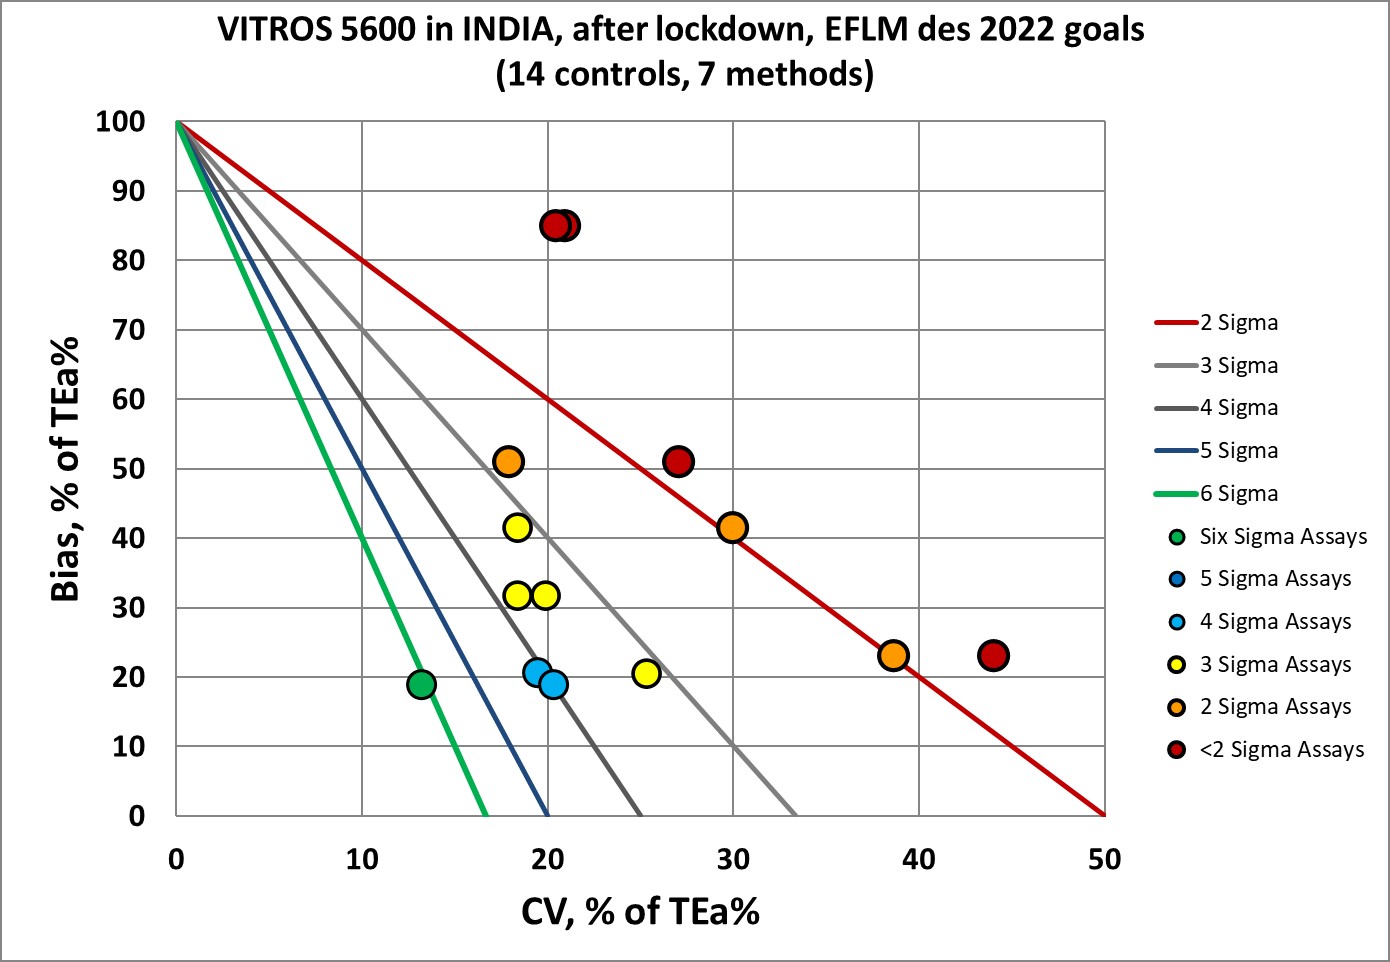
If those goals are used, there is almost nothing at the level of Six Sigma, and 50% of the performance is below 3 Sigma. The problem is not only bias but also imprecision.
So what happens if we lower the EFLM standards?.
Sigma-metrics according to EuBIVAS-derived MINIMUM performance specifications (before and during lockdown)
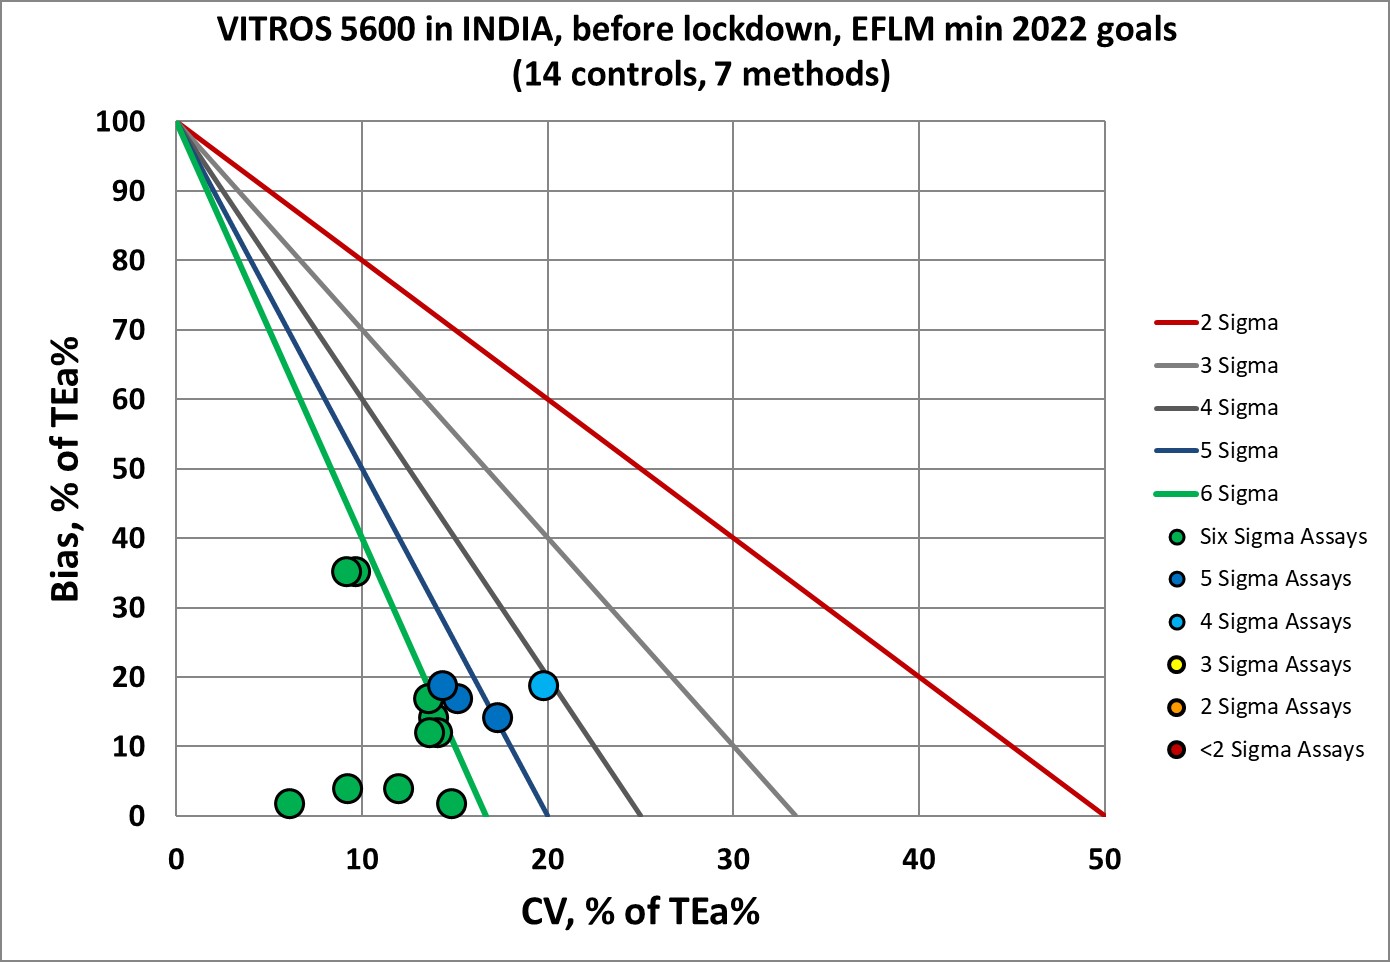
There is a huge improvement, now over 70% of the performance is at 5 and 6 Sigma, and nothing is below 4 Sigma. It's almost a complete reversal of the desirable specifications analysis. Of course, this is before the lockdown.
During the lockdown, things definitely got worse:
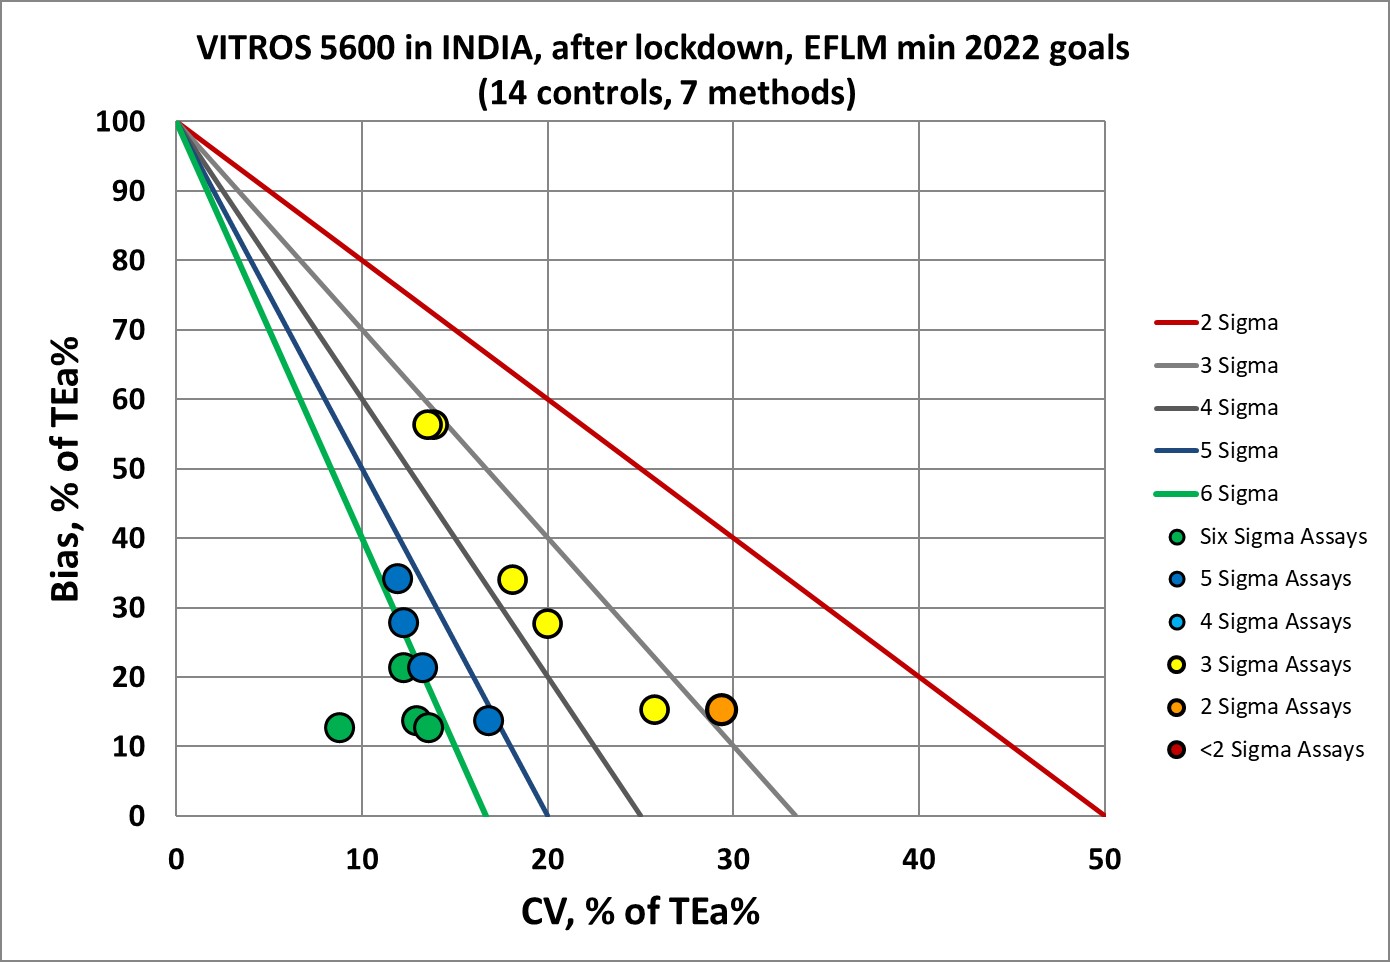
Only the half the performance is in 5 to 6 Sigma zones, which is still quite impressive, and significantly better than the desirable EFLM goals.
What about the "original" biological goals, from the "Ricos" database?
Sigma-metrics according to Ricos 2014 performance specifications (during lockdown)
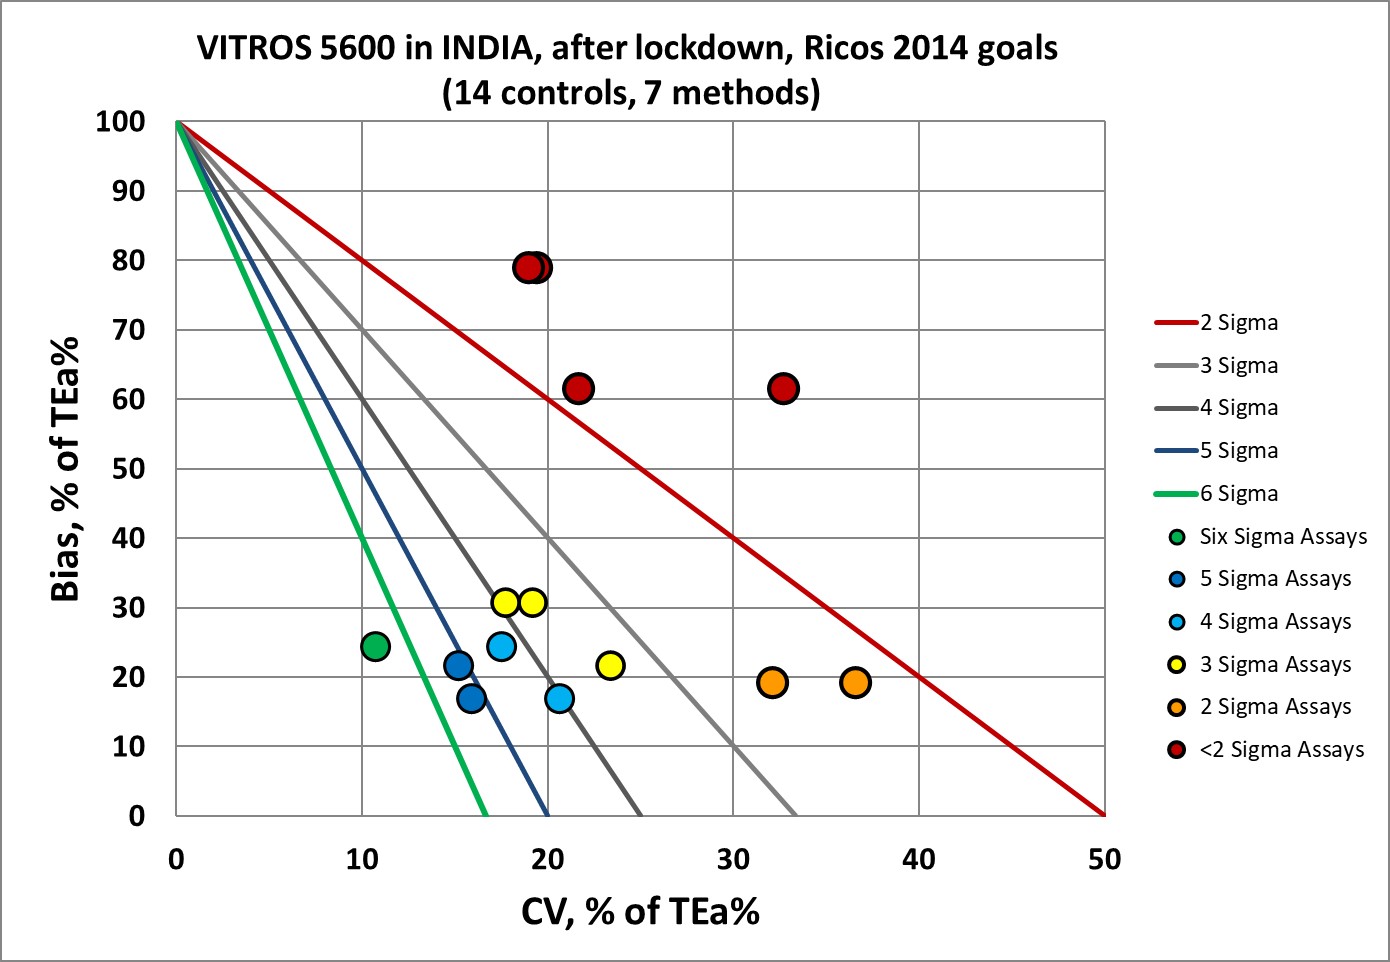
The older, desirable performance specifications give the VITROS 5600 a tough grade, only 1 assay in the bull's-eye, and almost half of the performance is below 2 sigma.
Now, what happens if we move away from biologically-derived goals toward the CLIA goals, including those newly announced to take effect in 2024? Let's start with the original, now "classic" CLIA goals issued in 1992.
Sigma-metrics according to CLIA 1992 performance specifications (during lockdown)
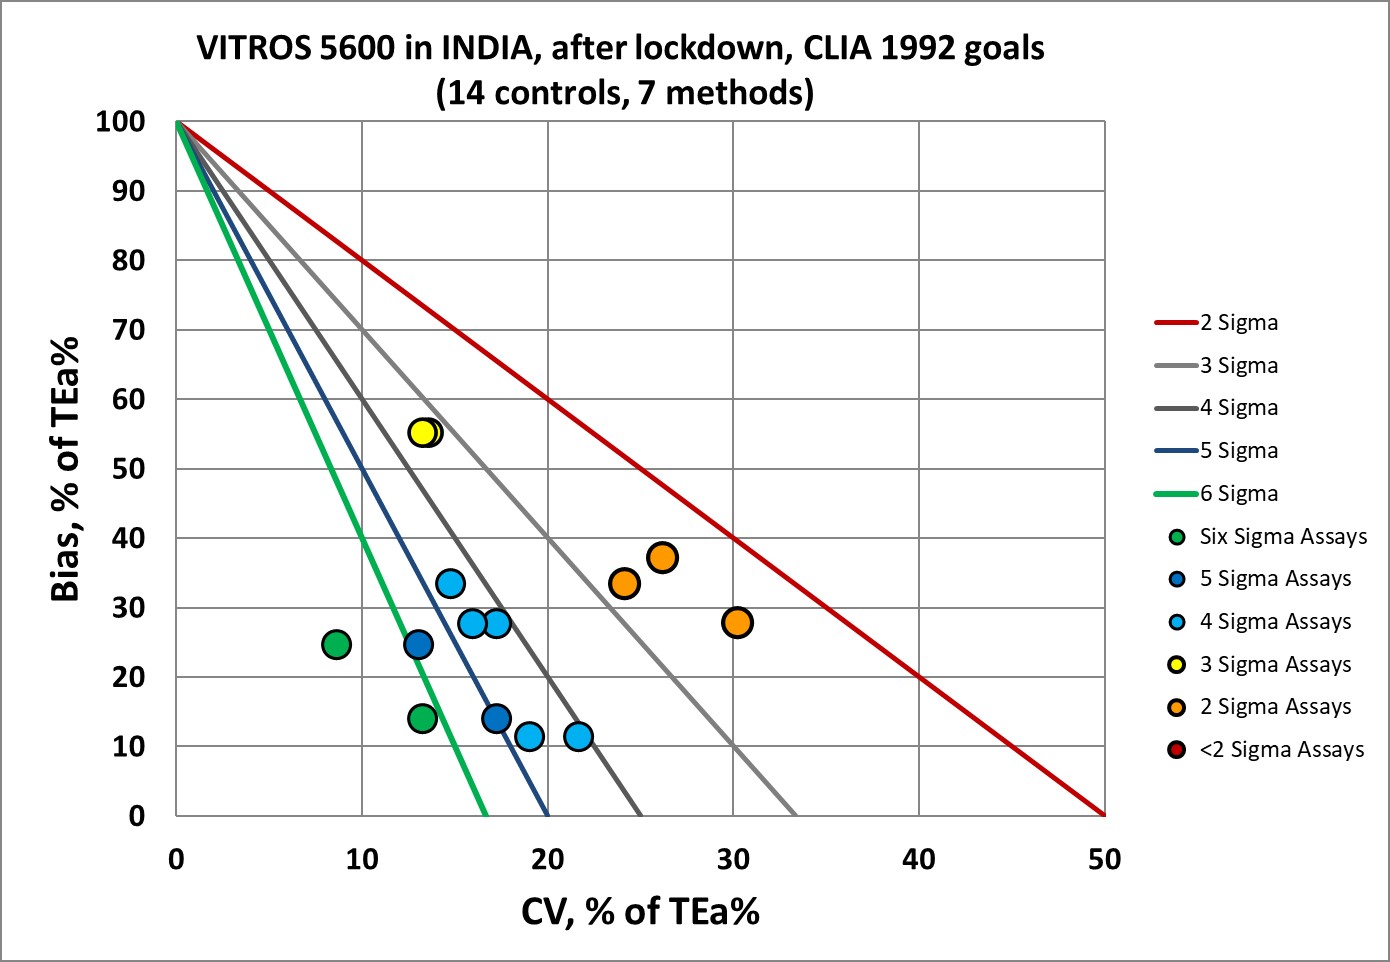
Interesting, even the goals from 30 years are tougher on the VITROS than the EFLM minimum goals of 2024.
Sigma-metrics according to CLIA 2024 performance specifications (before and during lockdown)
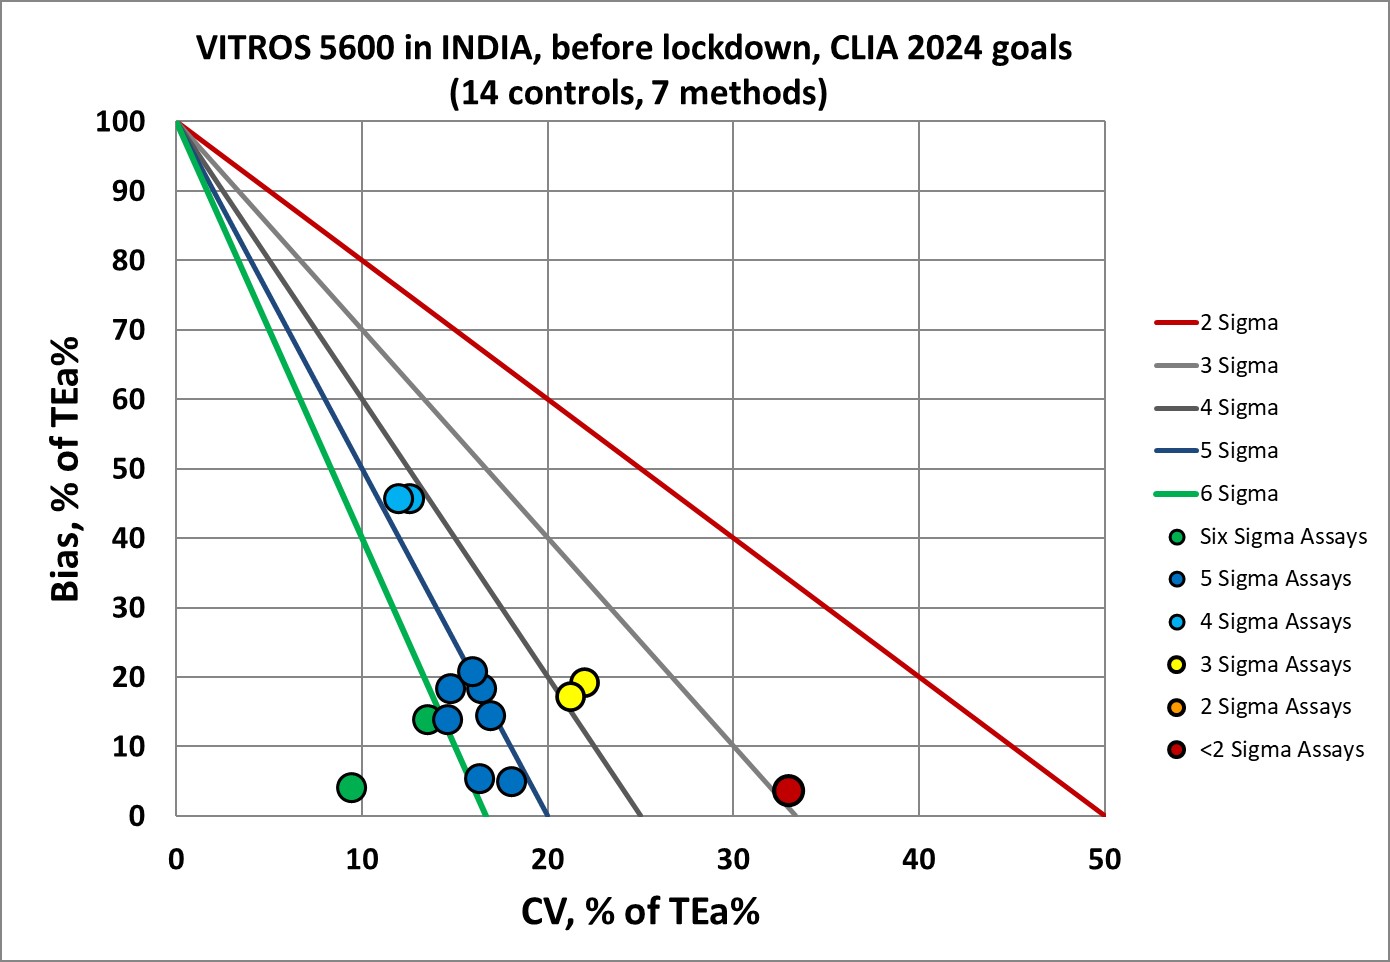
CLIA 2024 ends up somewhere in between EFLM minimum and desirable specifications. The center of gravity here seems to be 5 Sigma performance. Far fewer 6 Sigma assays here than EFLM analyses.
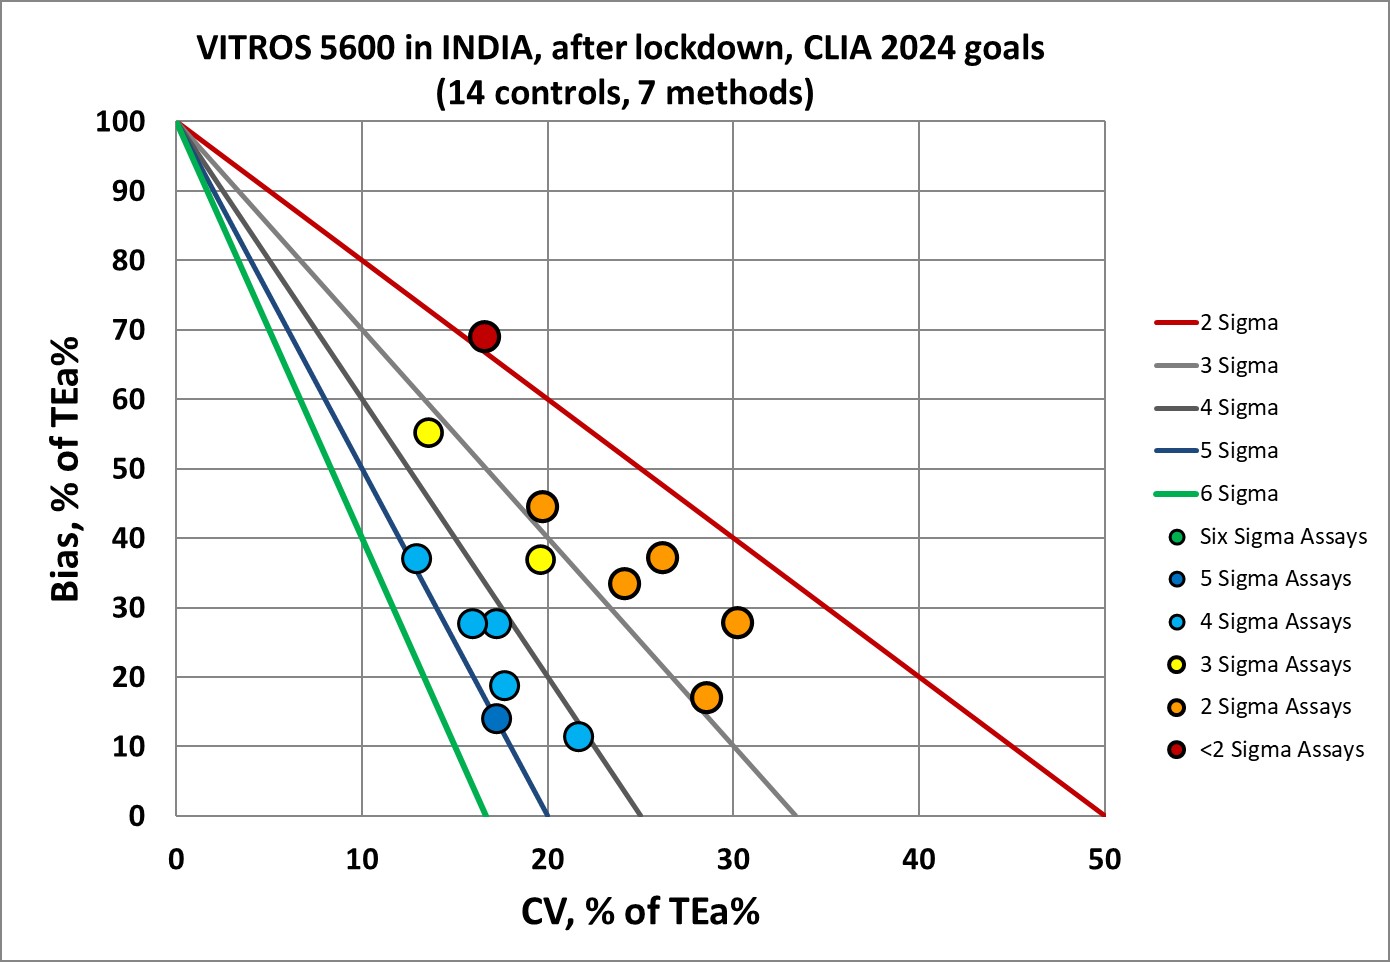
The impact of the lockdown, according to 2024 CLIA goals, was severe. Assays dropping full Sigma categories. Nothing left in the bull's-eye.
Conclusion
The impact of lockdown and other stresses on the laboratory impacted not only staff, but the analytical quality of results themselves. No matter what ruler we use, there is significant loss of analytical quality, something that should have resulted in the implementation of more control rules, more controls, and more frequent running of QC. Of course, it probably didn't. Therefore, that additional imprecision and bias was escaping the laboratory and adding more noise and confusion to the patient results. Right when the healthcare system was facing one of its most difficult crises, and the laboratory was making it harder to get the right answers.
Bonus Analysis: How are these assays judged when MU is compared to MAU, pU specifications?
As the title of the publcation indicates, the real goal of the authors was to assess measurement uncertainty. So let's take a good look at that. We can see the full array of the measurement uncertainty performance specifications on the Consolidated MU page.
| VITROS 5600 INDIA AFTER LOCKDOWN | %Bias | %CV | Expanded Uncertainty | EFLM minimum MAU | Panteghini's pU | Final verdict |
| Alk Phos | 7.380 | 3.930 | 7.86 | 9.9 | 2.65 (des) 3.98 (min) |
Fails pU, passes min MAU |
| Alk Phos | 7.380 | 2.600 | 5.2 | 9.9 | 2.65 (des) 3.98 (min) |
Fails pU, passes min MAU |
| ALT | 6.670 | 4.830 | 9.66 | 15.1 | 4.65 | Fails pU, passes min MAU |
| ALT | 6.670 | 2.960 | 5.92 | 15.1 | 4.65 | Fails pU, passes min MAU |
| AST | 2.790 | 3.460 | 6.92 | 14.4 | 4.75 (des) 7.13 (min) |
Passes min pU, passes min MAU |
| AST | 2.790 | 2.660 | 5.32 | 14.4 | 4.75 (des) 7.13 (min) |
Passes min pU, passes min MAU |
| Cholesterol | 2.760 | 1.730 | 4.498 | 7.9 | 3.0 (des) 7.0 (min) |
Passes min pU, passes min MAU |
| Cholesterol | 2.760 | 1.600 | 3.2 | 7.9 | 3.0 (des) 7.0 (min) |
Passes min pU, passes min MAU |
| Creatinine | 1.700 | 3.260 | 6.52 | 6.8 | 2.2 | Fails pU, passes min MAU |
| Creatinine | 1.700 | 2.860 | 5.72 | 6.8 | 2.2 | Fails pU, passes min MAU |
| Glucose | 5.520 | 1.360 | 2.72 | 7.5 | 2.0 | Fails pU, passes min MAU |
| Glucose | 5.520 | 1.330 | 2.66 | 7.5 | 2.0 | Fails pU, passes min MAU |
| Urea Nitrogen | 3.340 | 3.630 | 7.26 | 20.9 | 7.5 | Passes pU and min MAU |
| Urea Nitrogen | 3.340 | 2.360 | 4.73 | 20.9 | 7.5 | Passes pU and min MAU |
If we judge these assays by the various performance specifications set forth by Panteghini et al, there are few victories. Only Urea passes both the pU and minimum MAU standards. Only 3 of the 7 assays pass the pU standards (Urea, Cholesterol, AST). If the minimum MAU performance specifications are adopted instead, all of the assays pass. MAU is more forgiving than any TEa standard applied.