Quality of Laboratory Testing
Part VII: The Quality of PSA Testing
May 2005
with Sten Westgard, MS
The October 2004 issue of Clinical Laboratory Strategies headlined an article “Prostate Cancer Research Declares PSA Era ‘Over’” [1]. Thomas Stamey, who is credited with creating the PSA era, now thinks the test is “all but useless.” His most recent studies have shown that PSA now mainly indicates benign prostatic hyperplasia and is no longer useful as a screening test for prostatic cancer [2].One of us (the elder) wishes his urologist had read this article because his doctor believes in using tight cutoffs for PSA. These cutoffs are age-related national guidelines that range from 2.5 to 4.5 ng/mL, but they are considerably lower than the 10 ng/mL that is generally considered indicative of increased risk for prostatic cancer. Lab Tests Online describes the range from 4.0 to 10.0 ng/mL as a “gray zone” [3]. The main benefit of these lower cutoffs is to allow a urologist to get paid for doing biopsies. From a business point-of-view, PSA is a money maker for many diagnostic manufacturers, commercial laboratories, and urologists. For patients, the value is not so clear, especially for results less than 10 ng/mL.
Like glycohemoglobin (see part VI in this series), PSA is not a regulated analyte, which means that laboratories usually test only 2 specimens per PT event rather than the 5 specimens required for regulated analytes. And like glycohemoglobin, performance is graded on the curve, i.e., against the observed distribution, which represents the state of the art for current measurement procedures, rather than any defined requirement for quality.
Materials and Methods
Sigma-metrics have been estimated for PSA testing based on proficiency testing data collected during 2004. The available data is limited because only 2 specimens are provided per testing event and fewer laboratories actually perform this test.- CLIA does not define any criterion for acceptable performance. Therefore, we performed a “sensitivity assessment” to look the effect of a wide range of quality requirements equivalent to allowable total errors (TEa) from 10% to 50%.
- CAP 2004 survey specimens K-16 and K-17 provided data in the grey zone between 4 and 10 ng/mL (6.5 ng/mL) and a distinctly elevated level (19 ng/mL).
- The CAP PT results represent approximately 2300 laboratories. CAP provided the means and SDs for “all methods” as well as for 14 method subgroups.
- National Test Quality (NTQ) observed for a single proficiency testing sample is estimated from the CLIA total allowable total error (TEa) divided by the group SD or CV, i.e., Sigma = TEa/CV. The average NTQ observed for multiple surveys is weighted for the number of laboratories participating in the survey.
- Local Method Quality (LMQ) for a single proficiency testing sample is a weighted average of the Sigmas determined for each method subgroup without accounting for method bias, i.e., Sigma = TEa/CVmethsubgroup. The average LMQ observed for multiple surveys is weighted for the number of laboratories participating in each survey.
- National Method Quality (NMQ) observed for a single proficiency testing sample is a weighted average of the Sigmas determined for each method subgroup taking bias into account, i.e., Sigma = (TEa – biasmethsubgroup)/CVmethsubgroup. The average NMQ observed for multiple surveys is weighted for the number of laboratories patricipating in each survey.
Further details on the methodology are discussed in an earlier essay.
Results
Table 1 shows the proficiency testing results for 2350 CAP laboratories. The numbers of laboratories represent approximately a fourth the numbers from the earlier case studies for cholesterol, glucose, and calcium and half the number of labs performing glycohemoglobin tests. Because these are the largest and most highly automated laboratories, this data should provide an estimate of performance for the best laboratories.
Table 1. Summary of PSA Sigma Performance Metrics for Specified Quality Requirements |
|||||
| TEa in % | TEa in units | NTQ | NMQ | LMQ | Datasheet |
| Percent | ng/mL | ||||
|
A) At mean of 6.5 ng/mL |
|||||
| 10.0 | 0.65 | 1.17 | 0.87 | 1.76 | lA |
| 20.0 | 1.31 | 2.34 | 2.63 | 3.52 | 2A |
| 30.0 | 1.96 | 3.51 | 4.39 | 5.28 | 3A |
| 40.0 | 2.61 | 4.67 | 6.15 | 7.04 | 4A |
| 50.0 | 3.27 | 5.84 | 7.91 | 8.80 | 5A |
|
B) At mean of 19 ng/mL |
|||||
| 10.0 | 1.91 | 1.17 | 0.86 | 1.68 | 1B |
| 20.0 | 3.83 | 2.34 | 2.54 | 3.35 | 2B |
| 30.0 | 5.74 | 3.50 | 4.22 | 5.03 | 3B |
| 40.0 | 7.66 | 4.67 | 5.89 | 6.71 | 4B |
| 50.0 | 9.57 | 5.84 | 7.57 | 8.39 | 5B |
Part A in Table 1 shows the performance expected for the screening application, where cutoffs will be approximately in the 3 to 6 ng/mL range. The overall mean of the CAP specimen was determined to be 6.5 ng/mL. The performance expected for a distinctly elevated PSA level of 19 ng/mL is shown in part B of the table.
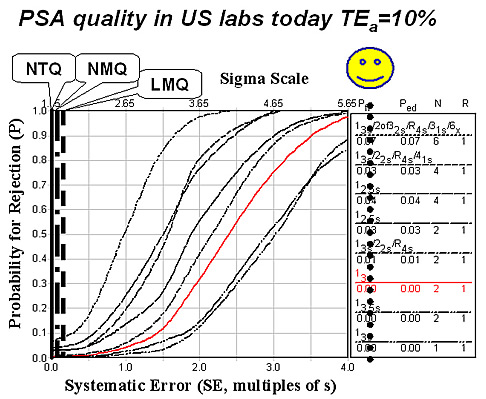
If TEa were 10%, meaning that the allowable total error would be 0.65 ng/mL for a specimen in the screening range, the estimates for NTQ, NMQ, and LMQ are all less than 2 Sigma. That means that elevations of 10% above today’s age-related medical cutoff limits can not be measured reliably! Laboratories cannot adequately control PSA measurements using methods with such low sigmas, as shown in the figure below by the location of these sigmas relative to the power curves for different QC procedures. If a laboratory utilized the CLIA minimum of 2 controls per run and a Levey-Jennings control chart having limits set as plus/minus 3s, then the 3rd curve from the bottom represents the available error detection of that QC procedure – which is essentially zero. There is no way to control these methods so that elevations of 10% above today’s age-related cutoffs are analytically reliable, to say nothing of whether or not they are medically useful.
If TEa were 20% or 1.31 ng/mL, then NTQ is 2.34 Sigma, NMQ 2.63 Sigma, and LMQ 3.52 Sigma - even elevations this large can’t be measured reliably! To have dependable performance at 4 Sigma or better means that the allowable errors must be as large as 40% or up to 2.6 ng/mL. A test value must be at least 2 or 3 units above present medical cutoffs to provide a reliable measurement that would be useful for triggering a biopsy of the patient.
Part B of Table 1 also makes it clear that even larger changes must be allowed for when monitoring elevated values. Above the 10 ng/mL end of the gray zone, methods only provide reliable performance for monitoring changes of 30% or greater.
At the 6.5 ng/mL level, the weighted average CV for method subgroups in the CAP survey data is seen to be 6.0%. The smallest CV observed is 3.6% and the largest 9.7%. Subgroup biases range from 0.86 to 0.05 ng/mL, giving a weighted average bias of 0.31 ng/mL. At the 19.1 ng/mL level, the weighted average CV for method subgroups is 6.2% and the weighted average bias is 0.85 ng/mL.
Discussion
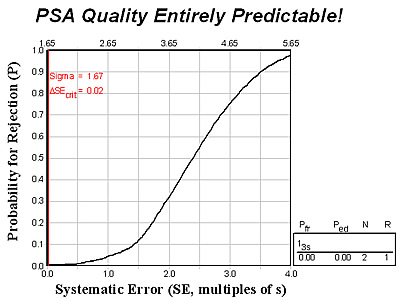
If physicians utilize national age-related cutoffs for interpreting PSA tests today, it should not be surprising that the PSA test WON’T provide reliable information. It can’t be adequately controlled, as shown in the next figure, which was predicted from an analytical QC Design model for an allowable total error of 10% and a method CV of 6.0% (and bias of zero).
The expected method sigma is 1.67 (vertical red line) which nearly coincides with the y-axis on the graph. The point where this line intersects the power curve gives the expected error detection, which is ZERO.
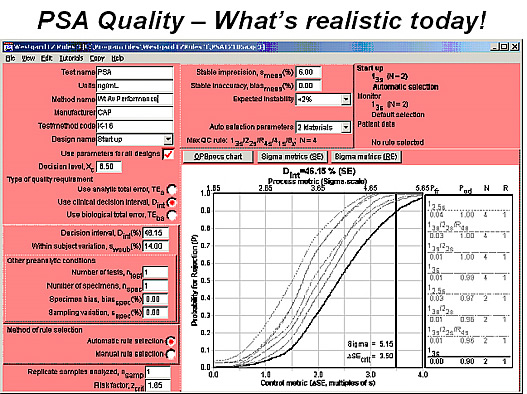
This QC Design model also confirms the need for a wide gray zone, as shown in the next figure where the input parameters specify a clinical decision interval of 3 ng/mL
At 6.5 ng/mL (or 46%), within subject biological variation of 14% (from Ricos), and typical method performance of a 6.0% CV (and assuming no bias).
The bold line represents the power curve for a control procedure using a 13s rule and 2 control measurements per run (i.e., a Levey-Jennings control chart having control limits set at the mean plus/minus 3 standard deviations). Note the intersection of the vertical line that represents the method sigma performance (5.15 sigma) and the critical systematic error that must be detected (3.5s), which shows a probability of error detection of 0.90 or a 90% chance of detecting a medically important error. Elevations of 3 ng/mL can be reliably detected with today’s analytical methods when controlled by the CLIA minimum of 2 controls per run.
Conclusion
Today’s evidence-based medical practice guidelines for PSA testing AREN’T reliable for use with national age-related cutoffs! The quality of PSA testing in the biggest and best laboratories is not good enough to reliably detect small increases above these cutoffs. That will come as no surprise to many patients who have been subjected to biopsies because of small elevations in their PSA tests. But, even Stamey’s assessment that PSA is no longer useful as a screening test may not be able to slow down the healthcare business machine.
References
- “Prostate cancer research declares PSA era ‘over’.” Clinical Laboratory Strategies 2004;9(Oct):1,9.
- Stamey et al. J Urol 2004;172:1297-1301.
- http://www.labtestsonline.org/understanding/analytes/psa/test.html
- Westgard JO, Hyltoft Petersen P, Wiebe DA. Laboratory process specifications for assuring the quality in the US National Cholesterol Education Program. Clin Chem 1991;37:656-661.
- Ricos C, Alvarez V, Cava F, et al. Current databases on biological variation: pros, cons and progress. Scand J Clin Lab Invest 1999;59:491-500.
James O. Westgard, PhD, is a professor of pathology and laboratory medicine at the University of Wisconsin Medical School, Madison. He also is president of Westgard QC, Inc., (Madison, Wis.) which provides tools, technology, and training for laboratory quality management.
