Quality of Laboratory Testing
Part VIII: The Quality of Coag Testing
June 2005
with Sten Westgard, MS
The January 2005 issue of Clinical Laboratory News included an article on “Coagulation Monitoring: Meeting the demand for Point-of-Care testing” [1]. The article identified some dozen or so companies that now market POC coagulation instruments. The author cautioned readers that “the availability of POC coagulation monitoring does not automatically translate into better patient care” and advised laboratorians to carefully evaluate new POC methods and to participate in the on-going quality management of POC testing services.
Also in January 2005, the results of a survey of hospital coagulation laboratories was published and noted that “substantial variability in certain laboratory practices was evident” [2]. One section of this study specifically addressed POC testing for prothrombin time and found that 6.4% of hospitals provided such service and that 87% of these hospitals (in the year 2001 when the survey was conducted) reported that the laboratory was responsible for the POC testing, including regulatory compliance. There were no figures that described the actual quality being achieved by hospitals and/or POC sites, but the survey suggests that there are many variables in current practice which might be expected to translate to variations in quality.
Materials and Methods
Sigma-metrics have been estimated for Prothrombin Time, International Normalized Ratio (INR), and fibrinogen on the basis of proficiency testing data collected during 2004. The data represent results from 2 CAP testing events, with a total of 10 specimens.- Fibrinogen is included in this assessment to provide a benchmark for comparison. Prothrombin Time is known to be affected by changes in reagent lots, which make it susceptible to variations that may not be present in other related tests. INR is included because this ratio is supposed to minimize such variations.
- CLIA defines criteria for acceptable performance for Prothrombin Time (TEa=15%) and fibrinogen (TEa=20%). CAP defines a TEa criterion of 20% for the acceptable performance of INR.
- CAP 2004 survey specimens were from events A and C. For Prothrombin Time, event A had 5 out of 5 “normal” results, whereas event B had 4 out of 5 “abnormal” results.
- The CAP results represent approximately 800 laboratories for Prothrombin Time and INR and 900 laboratories for fibrinogen. CAP did not provide the overall means and SDs for “all methods” for PT and INR, but did provide means and SDs for 21 method subgroups. For fibrinogen, the overall means and SDs were provided, along with the means and SDs for 15 method subgroups.
- National Test Quality (NTQ) observed for a single proficiency testing sample is estimated from the CLIA total allowable total error (TEa) divided by the group SD or CV, i.e., Sigma = TEa/CV. The average NTQ observed for multiple surveys is weighted for the number of laboratories participating in the survey.
- Local Method Quality (LMQ) for a single proficiency testing sample is a weighted average of the Sigmas determined for each method subgroup without accounting for method bias, i.e., Sigma = TEa/CVmethsubgroup. The average LMQ observed for multiple surveys is weighted for the number of laboratories participating in each survey.
- National Method Quality (NMQ) observed for a single proficiency testing sample is a weighted average of the Sigmas determined for each method subgroup taking bias into account, i.e., Sigma = (TEa – biasmethsubgroup)/CVmethsubgroup. The average NMQ observed for multiple surveys is weighted for the number of laboratories patricipating in each survey.
Further details on the methodology are discussed in an earlier essay.
Results
The table below shows the estimates of quality for Prothrombin Time, INR, and fibrinogen using the quality requirements defined by CLIA and CAP. The first column identifies the CAP specimen, the 2nd the mean result for that specimen, followed by the estimates of NTQ, NMQ, and LMQ. Note again that NTQ could not be estimated for Prothrombin Time and INR because the CAP survey results did not include “all methods” means and SDs.| CAP Specimen | Mean | NTQ | NMQ | LMQ | |
| Prothrombin Time with TEa=15% |
|||||
| CG2-01 | 12.3 sec | 3.07 Sigma | 6.38 Sigma | ||
| CG2-02 | 11.6 | 2.33 | 5.18 | ||
| CG2-03 | 12.6 | 2.94 | 5.75 | ||
| CG2-04 | 14.0 | 3.03 | 5.93 | ||
| CG2-05P | 12.3 | 2.72 | 5.69 | ||
| CG2-11 | 23.8 | 0.00 | 4.40 | ||
| CG2-12 | 23.3 | 0.35 | 4.85 | ||
| CG2-13 | 11.9 | 3.10 | 6.47 | ||
| CG2-14 | 26.0 | 0.00 | 4.17 | ||
| CG2-15P | 20.6 | 0.92 | 4.66 | ||
| Average | 16.8 | 1.77 | 5.35 | ||
| CAP Specimen | Mean | NTQ | NMQ | LMQ | |
| International Normalized Ratio with TEa=20% |
|||||
| CG2-01 | 1.0 | 2.57 Sigma | 3.59 Sigma | ||
| CG2-02 | 0.94 | 2.63 | 3.19 | ||
| CG2-03 | 1.05 | 2.54 | 3.51 | ||
| CG2-04 | 1.20 | 2.19 | 3.24 | ||
| CG2-05P | 1.02 | 2.74 | 3.47 | ||
| CG2-11 | 2.41 | 2.10 | 3.68 | ||
| CG2-12 | 2.39 | 1.91 | 3.53 | ||
| CG2-13 | 0.97 | 3.04 | 3.91 | ||
| CG2-14 | 2.73 | 2.06 | 3.58 | ||
| CG2-15P | 2.03 | 2.13 | 3.48 | ||
| Average | 1.57 | 2.39 | 3.52 | ||
| CAP Specimen | Mean | NTQ | NMQ | LMQ | |
| Fibrinogen with TEa=20% |
|||||
| CG2-01 | 249 mg/dL | 2.41 Sigma | 2.59 Sigma | 3.50 Sigma | |
| CG2-02 | 2.94 | 2.11 | 2.33 | 3.25 | |
| CG2-03 | 207 | 1.41 | 1.37 | 2.97 | |
| CG2-04 | 168 | 1.04 | 0.66 | 2.56 | |
| CG2-05P | 205 | 1.42 | 1.80 | 3.47 | |
| CG2-11 | 352 | 2.02 | 2.44 | 3.32 | |
| CG2-12 | 237 | 1.54 | 2.06 | 3.40 | |
| CG2-13 | 227 | 2.27 | 2.41 | 3.38 | |
| CG2-14 | 355 | 2.08 | 2.57 | 3.45 | |
| CG2-15P | 204 | 1.54 | 1.84 | 3.14 | |
| Average | 260 | 1.78 | 2.01 | 3.24 | |
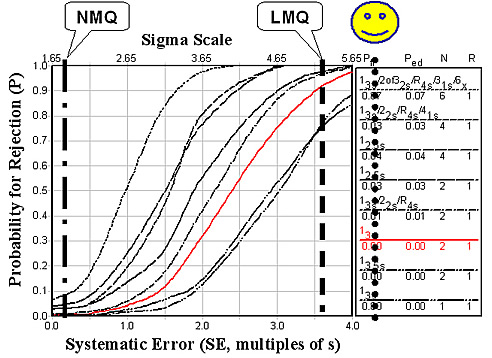
For Prothrombin Time, the estimates for NMQ and LMQ are quite different, as shown in the figure below. The estimate of LMQ is 5.35 sigma, which is very high and demonstrates the excellent precision of today’s automated systems. When method bias is included by the estimate of NMQ, Sigma is only 1.77 due to the variables that cause systematic difference between method subgroups.

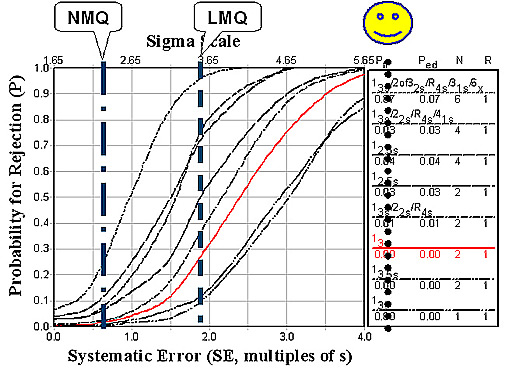
For INR, it is hoped that systematic changes between method subgroups would be compensated by the ratio calculation. As shown in the figure below, that compensation is only partially successful. LMQ is actually reduced to 3.52 sigma and NMQ increases only to 2.39 sigma.

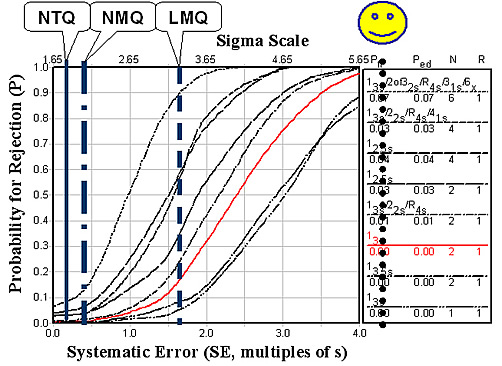
Fibrinogen shows similar test quality, as shown in the figure below. LMQ is 3.24 sigma, NMQ 2.01 sigma, and NTQ 1.78 sigma.

Discussion
The quality of coagulation monitoring, as assessed here, applies to moderate to large clinical laboratories that utilize highly automated testing systems. These estimates likely represent the best of what is being achieved in coagulation testing today.Prothrombin Time would provide excellent quality if laboratories accurately determined their reference limits and therapeutic ranges (i.e., applied locally determined limits for test interpretation). However, such practices are quite variable [2]: 58.7% of labs use less than 40 subjects to establish reference limits, even though the CLSI recommends a minimum of 120 subjects; 10.3% of labs conduct no such studies, choosing instead to use recommendations in the manufacturer’s inserts or values published in the scientific literature.
Use of the INR does not offer much improvement in the quality of coagulation testing. Local method quality is actually reduced (5.35 to 3.52 sigma), which indicates that the value for the International Sensitivity Index (ISI) itself contributes some variability. National method quality shows modest improvement (1.8 to 2.4 sigma).
Given this state of quality in the largest laboratories with the most advanced instrument systems, there should be considerable concern about extending coagulation monitoring to POC sites. It is difficult to adequately QC these tests when performed by automated systems in central laboratories. CLIA's minimum QC requirement of 2 levels per run will not provide adequate detection of medically important errors, as shown by the intersections of the vertical lines and the power curve for 13s and N=2 in the figures above. The performance of POC systems is not expected to be as good, therefore, it will be even more difficult to monitor the quality of POC testing.
Conclusion
Earlier assessments for routine chemistry tests (cholesterol, glucose, calcium) and special chemistry tests (glycohemoglobin, PSA) have shown that the national quality of laboratory tests is not very good. The estimates for the routine chemistry tests ranged from 2.9 to 3.3 sigma and those for GHb and PSA were from 1.2 to 3.2 sigma. The additional estimates for coagulation tests (Prothrombin Time, INR, fibrinogen) show similar estimates for national quality, ranging from 1.8 to 3.5 sigma. Thus, the issue of test quality is not just with chemistry tests! The issue also concerns coagulation tests and quite likely many of the other tests performed in the laboratory.References
- Choi T-S. Coagulation Monitoring: Meeting the Demand for Point-of-Care Testing. Clinical Laboratory News 2005;1(Jan):10-12.
- Shahangian S, Stankovic AK, Lubin IM, Handssfield JH, White MD. Results of a survey of hospital coagulation laboratories in the United States, 2001. Arch Pathol Lab Med 2005;129:47-60.
James O. Westgard, PhD, is a professor of pathology and laboratory medicine at the University of Wisconsin Medical School, Madison. He also is president of Westgard QC, Inc., (Madison, Wis.) which provides tools, technology, and training for laboratory quality management.
