Quality of Laboratory Testing
Part IX: Variability of survey estimates
October 2005
with Sten Westgard, MS
We have assessed the quality of several tests in this series using data from several different proficiency testing programs. The laboratories that participate in these different programs are probably best differentiated by size, i.e., some programs serve office labs and others serve larger clinics and small hospitals, medium sized hospitals, and large hospitals. The number of participants in these survey programs also varies from a few hundred to several thousand laboratories. The large survey programs also provide proficiency testing services (and data) for a larger number of tests.
At this point, one of our interests is to refine our quality assessment methodology to see if CAP data alone would be sufficient for describing the current quality of laboratory tests. Therefore, we need to assess the variability of the estimates of quality. The first part of this assessment will compare the estimates of quality from the different survey programs. A second part will compare the estimates of quality from different survey samples.
Materials and Methods
Sigma-metrics were estimated for cholesterol, glucose, and calcium tests based on proficiency testing data collected during 2004.- The CLIA criteria for acceptability in proficiency testing were taken as the national requirements for quality. For cholesterol, the allowable total error (TEa) is 10%, for glucose 6 mg/dL or 10.0%, whichever is larger, and for calcium 1.0mg/dL.
- PT data comes from 2004 surveys performed by the American Academy of Family Physicians (AAFP), Medical Laboratory Evaluation (MLE), American Association of Bioanalysts (AAB), American Proficiency Institute (API), College of American Pathologists (CAP), and New York State (NY).
- National Test Quality (NTQ) observed for a single proficiency testing sample is estimated from the CLIA total allowable total error (TEa) divided by the group SD or CV, i.e., Sigma = TEa/CV. The average NTQ observed for multiple surveys is weighted for the number of laboratories participating in the survey.
- Local Method Quality (LMQ) for a single proficiency testing sample is a weighted average of the Sigmas determined for each method subgroup without accounting for method bias, i.e., Sigma = TEa/CVmethsubgroup. The average LMQ observed for multiple surveys is weighted for the number of laboratories participating in each survey.
- National Method Quality (NMQ) observed for a single proficiency testing sample is a weighted average of the Sigmas determined for each method subgroup taking bias into account, i.e., Sigma = (TEa – biasmethsubgroup)/CVmethsubgroup. The average NMQ observed for multiple surveys is weighted for the number of laboratories patricipating in each survey.
Results
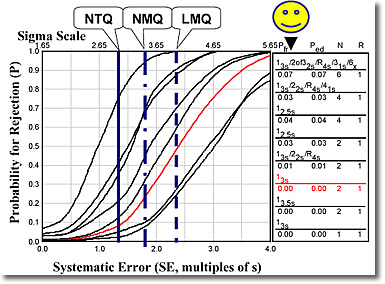
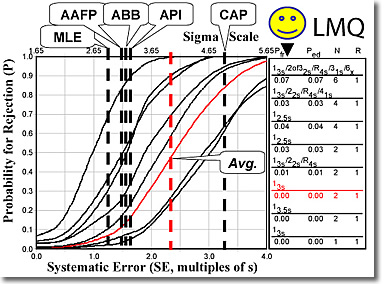
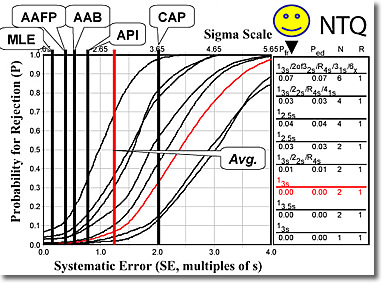
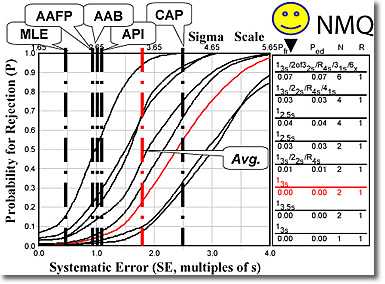
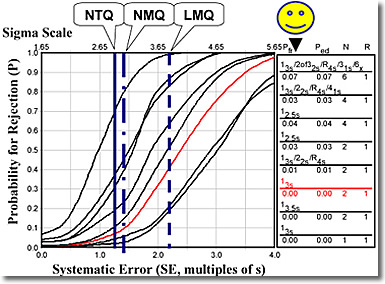
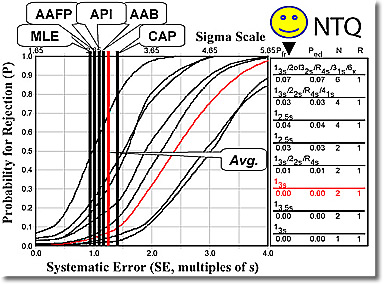
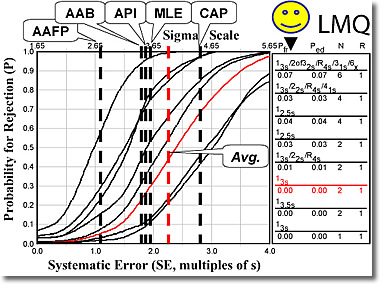
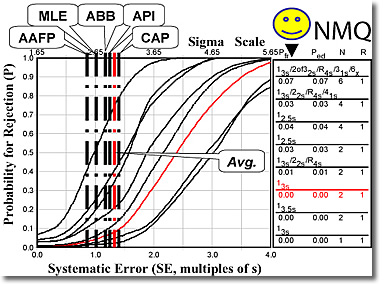
The data and summary figures for cholesterol, glucose, and calcium were provided in parts III, IV, and V in this series. Our purpose here is to more closely examine the estimates of quality that are obtained from the different survey programs. To do this, we employ the same graphic description that shows the estimated sigma-metric (upper x-scale) or related critical systematic error (lower x-scale) vs the probability of detection of systematic errors that would cause the CLIA quality requirement to be exceeded. Detection of such errors would be critical for assuring the quality of the laboratory test. The error detection capabilities of different QC rules and numbers of control measurements (N) are also shown by this graphic, where the highlighted (red) power curve corresponds to 2 levels of control per run and 3s control limits.
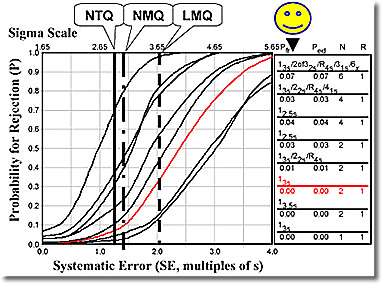
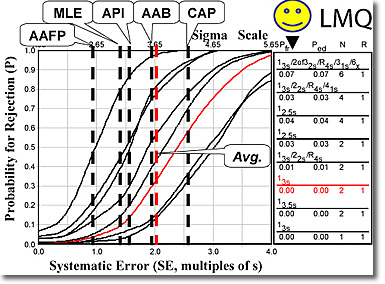
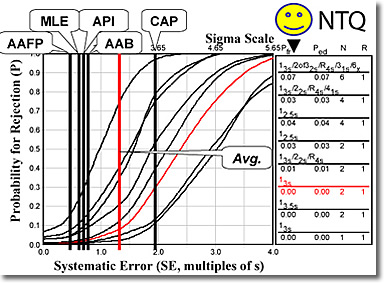
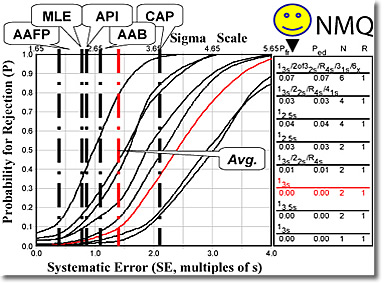
Cholesterol. The estimates of quality are shown in the first figure. The upper left graphic shows the weighted averages for National Test Quality (NTQ), National Method Quality (NMQ), and Local Method Quality (LMQ). The lower left graphic shows the estimates for NTQ from the different survey programs. The NTQ from AAFP (2.01 sigma), MLE (2.27 sigma), API (2.28 sigma), and AAB (2.37 sigma) surveys are distinctly lower than from CAP (3.57 sigma). The weighted average is 2.88 sigma, as shown by the red vertical line. The lower right graphic shows a similar distribution for NMQ shifted slightly to the right and the upper right graphic shows the LMQ distribution shifted a still a little further to the right. In all cases, the estimates of quality from the CAP survey are the highest and thus provide the most optimistic estimates of quality.
 |
 |
 |
 |
Glucose. The second figure shows the estimates of quality for glucose. Again, the upper left graphic shows the weighted averages for NTQ, NMQ, and LMQ. The lower left graphic shows the estimates for NTQ from the different survey programs. The lower right graphics shows the estimates for NMQ which are somewhat higher, but distributed in a similar way. The upper right graphic shows the estimates for LMQ which are still higher. In all cases, the estimates of quality from the CAP survey are the highest.
 |
 |
 |
 |
Calcium. The last figure shows the estimates of quality for calcium. Again, the upper left graphic shows the weighted averages for NTQ, NMQ, and LMQ. The lower left graphic shows the estimates for NTQ for the different survey programs. Note that the distribution of results is actually quite narrow. Likewise, the distribution of the estimates for NMQ in the lower right is slightly higher and again quite narrow. The upper right graphic shows a somewhat wider distribution that is considerable further to the right. Again, in all cases the estimates of quality from the CAP survey are the highest.
 |
 |
 |
 |
Discussion
The difference in the distribution of calcium quality versus those for cholesterol and glucose suggests that the available test methodology is a fundamental factor affecting the quality of calcium tests in all laboratories. The quality of cholesterol and glucose testing may be more dependent on the size of the laboratory, which could be also be attributable to the test methodology, but may also reflect the skills of the analysts.In all cases, the estimates of quality from the CAP survey are the highest when compared to other survey programs. Therefore, it is likely that any estimate of quality based solely on CAP survey results will be on the high side, i.e., the estimates of sigma will be higher that would be obtained from any of the other survey programs.
Conclusion
If we adapt our quality assessment methodology to employ only CAP survey results, the estimates of quality will be optimistic. Nonetheless, such estimates should still be useful measures of the quality of laboratory testing today. The actual quality might be worse, but it won’t likely be any better. For example, if the estimate of quality from the CAP survey were less than 5 sigma, that information is sufficient to answer the question about the adequacy of today’s QC practices, such as the minimal of 2 levels of control per day. That information is also sufficient to assess the adequacy of CMS’s proposed EQC guidelines that would allow reductions of daily QC to weekly or even monthly QC. Reduced QC should require methods that demonstrate quality at the 5 sigma level, or better.
James O. Westgard, PhD, is a professor of pathology and laboratory medicine at the University of Wisconsin Medical School, Madison. He also is president of Westgard QC, Inc., (Madison, Wis.) which provides tools, technology, and training for laboratory quality management.
