Tools
| Please note: These tools use "pop-ups" to display the results of your entered data. If you have a browser that blocks pop-up windows, you may not be able to see any graphs. Also, we recommend using Firefox or Opera browsers. Internet Explorer browsers, particularly earlier than version 6, may not correctly display the graphs.
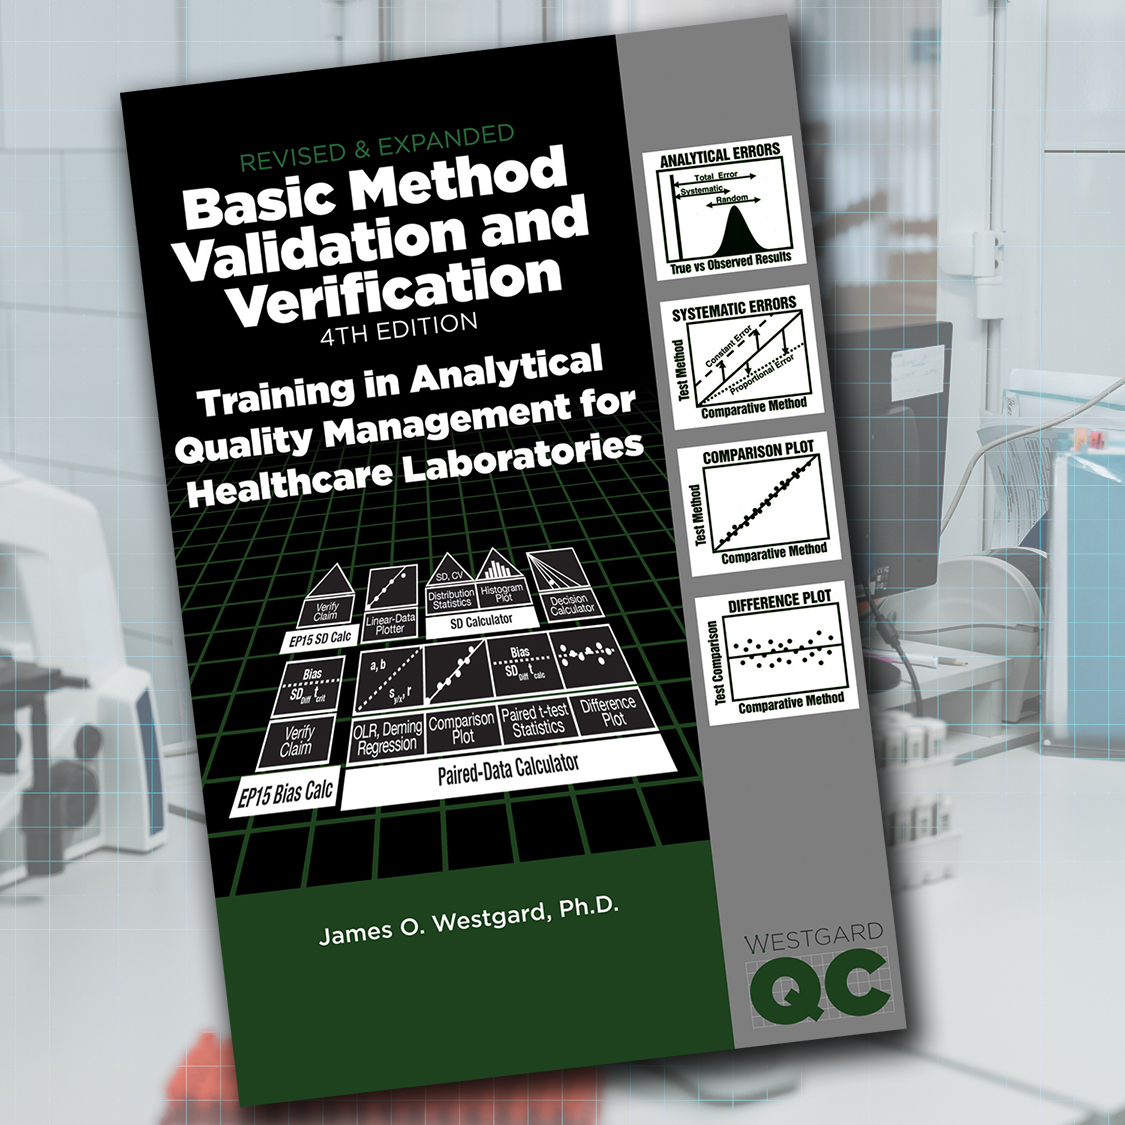
We also encourage our visitors to get the latest, most up-to-date information on Method Validation in the fourth edition of the Basic Method Validation manual. |
 |
· Linear-data plotter can be used with data from a linearity experiment to assess the reportable range of a method. It provides a plot of the average of a group of replicate test results on the y-axis versus the assigned value (in % or concentration units) on the x-axis.
· SD Calculator can be with data from a replication experiment to calculate the mean, standard deviation (SD or smeas), and coefficient of variation (CV). A histogram display of the data is also available.
· Paired-data Calculator. This tool is only available through the Westgard MV Tool kit. The tool can be used with data from a comparison of methods experiment to calculate linear regression statistics (slope, y-intercept, and standard deviation about the regression line, s:y/x), and the correlation coefficient (r, Pearson product moment correlation coefficient); t-test statistics (average difference between two methods or bias:meas; SD:diff, standard deviation of the differences between the two methods). It can also be used to provide a "comparison plot" that shows the test method results on the y-axis versus the comparative method results on the x-axis, as well as a "difference plot" that displays the difference between the test minus comparative results on the y-axis versus the comparative method result on the x-axis.
· Method Decision Calculator. This tool is only available through the Westgard MV Tool kit. For those who prefer not to pay for access, you can still download a Six Sigma Method Decision spreadsheet.
James O. Westgard and Paul Schilling
QC Calculator
Can be used with initial replication data from a control material to calculate the mean, SD, CV, and control limits. Can also be used to calculate cumulative mean, SD, CV, and control limits when user enters summation terms from earlier calculations. Prepares a blank control chart that can be printed.
QC Plotter
Can be used to display control results on a control chart. User enters the mean and SD for a control material (available from QC Calculator), specifies the control limits to be drawn on the chart, and enters up to 60 control results to be plotted on the control chart that can be printed.
QC Simulator- this tool is only available with the Basic QC Practices online course, or the Basic QC Practices 4th edition manual
Can be used to prepare trial sets of data that demonstrate the effects of systematic errors (shift of mean) and random errors (increase in SD). User can display these trial sets of data in the form of histograms and can also view these data on a control chart whose limits represent the stable mean and SD of a method. Useful to learn how different analytical errors affect the control results.
QC Trainer - this tool is only available with the Basic QC Practices online course, or the Basic QC Practices 4th edition manual
Can be used to generate simulated data that can be used to practice the interpretation of different control rules, such as 13s, 12s, and 13s/22s/R4s with N=2, 13s, 12s, and 13s/22s/R4s with N=3, and 13s, 12s, and 13s/22s/R4s/41s with N=4. User can select the number of control measurements per run (N/run) and the control rules to be applied, display control results for the next run, interpret that data to judge the control status, and have the program verify the correctness of that interpretation. Useful to train analysts to properly interpret control data using specific control rules
QC Checker - this tool is only available with the Basic QC Practices online course, or the Basic QC Practices 4th edition manual
Can be used to manually enter control values for display on a control chart and for checking control status by selected control rules. The user enters the values for one run, checks control status, then enters the values for the next run, etc. Assists the user in checking specific sets of control data and for clarifying the interpretation of the control results.
Here are two tools - Method Planner for establishing the specifications for imprecision and inaccuracy that are needed for cost-effective operation of a method, and QC Planner for selecting a QC procedure that is appropriate for the quality required for the test and the imprecision and inaccuracy observed for a method.
Method Planner can be used to establish the specifications for a method's CV and bias. You simply enter the quality required for the test (as an allowable total error), select the number of control materials that would be used for routine monitoring, and click the button to prepare the appropriate chart of operating specifications (OPSpecs chart).
- Select the control rules and total number of control measurements that you want to utilize for QC in your laboratory, identify the corresponding operating line for that QC procedure, then read the x-intercept to determine the maximum allowable imprecision (given as CV, %) for a bias of zero.
- For a non-zero bias, identify the operating line for the control rules and N of interest, find the y-coordinate that corresponds to the bias of interest, then read the allowable imprecision from the x-scale.
QC Planner can be used to select appropriate control rules and the total number of control measurements (N) that are needed. You simply enter the quality requirement for the test (as an allowable total error, %), enter the observed imprecision (CV,%) and observed bias (in %) for your method, select the number of control materials to be analyzed (two or three), and click the button to plot the operating point of your method on the appropriate OPSpecs chart.
- Inspect the 90%AQA OPSpecs chart for low N to see if the operating lines of any of the QC procedures are above your operating point. If so, identify the rules, N, and probability for false rejection (Pfr) for those lines and select the QC procedure that has the lowest Pfr and is practical to implement in your laboratory.
- Inspect the 90%AQA OPSpecs chart for high N to see if the operating lines of any of the QC procedures are above your operating point. If so, identify the rules, N, and probability for false rejection (Pfr) for those lines and select the QC procedure that has the lowest Pfr and is practical to implement in your laboratory.
- Inspect the 50%AQA OPSpecs chart for high N to see if the operating lines of any of the QC procedures are above your operating point. If so, identify the rules, N, and probability for false rejection (Pfr) for those lines and select the QC procedure whose line is highest, has the lowest Pfr, and is practical to implement in your laboratory.
