Basic QC Practices
Would this QC get you fired?
A user submitted a very interesting scenario: a mysterious discrepancy between the instrument records and the LIS records of QC values. Do you think your laboratory could this mystery?
The Case of the Out-and-In-Control QC
Sten Westgard, MS
October 2014
Recently, one of our readers sent in a mystery: a set of discrepant QC results. For this laboratory, QC data points recorded on the instrument did not match with some data points recorded at the LIS. Now I should immediately note that this laboratory had already solved the mystery - they just wanted to share some of what they had experienced and try to help other labs in the future.
For obvious reasons, we're going to refrain from identifying the laboratory's name and the employees involved. This isn't an attempt to single out an individual lab or personnel. That's not the point of this article.
The data
At different dates, an audit of instrument records and LIS records discovered different QC values for a few analytes:
| Magnesium, example 1 |
|
| LIS QC result | 2.0 |
| Control range | 1.78 - 2.02 |
| Analyzer audit report | 2.1 and 2.2 |
First off, you can see that the analyzer had some values that were out. Presumably, a control was out, it was repeated and it was still out. But the LIS value is in.
| Magnesium, example 2 |
|
| LIS QC result | 2.0 |
| Control range | 1.78 - 2.02 |
| Analyzer audit report | 2.1 |
Here, same analyte, similar scenario. This time it doesn't look like the control was repeated.
| Calcium |
|
| LIS QC result | 13.0 |
| Control range | 12.4 - 13.00 |
| Analyzer audit report | 13.3 and 13.3 |
This calcium example is just like the first magnesium example. There are two out-of-control values recorded on the instrument and then an in-control value recorded on the LIS.
Have you figured out what's happening? (How many times do you think the control is being repeated here?)
Maybe some graphs will help
Rather than stare at cryptic tables, let's plot this on Levey-Jennings charts. We'll start by stating that the first few points on each graph are not real. I just threw in some "random" data before the event to make the chart look more familiar, more like a typical Levey-Jennings chart. The only data that really matters are the points that have arrows pointing at them, as well as the red dots that represent the data points recorded at the LIS level.
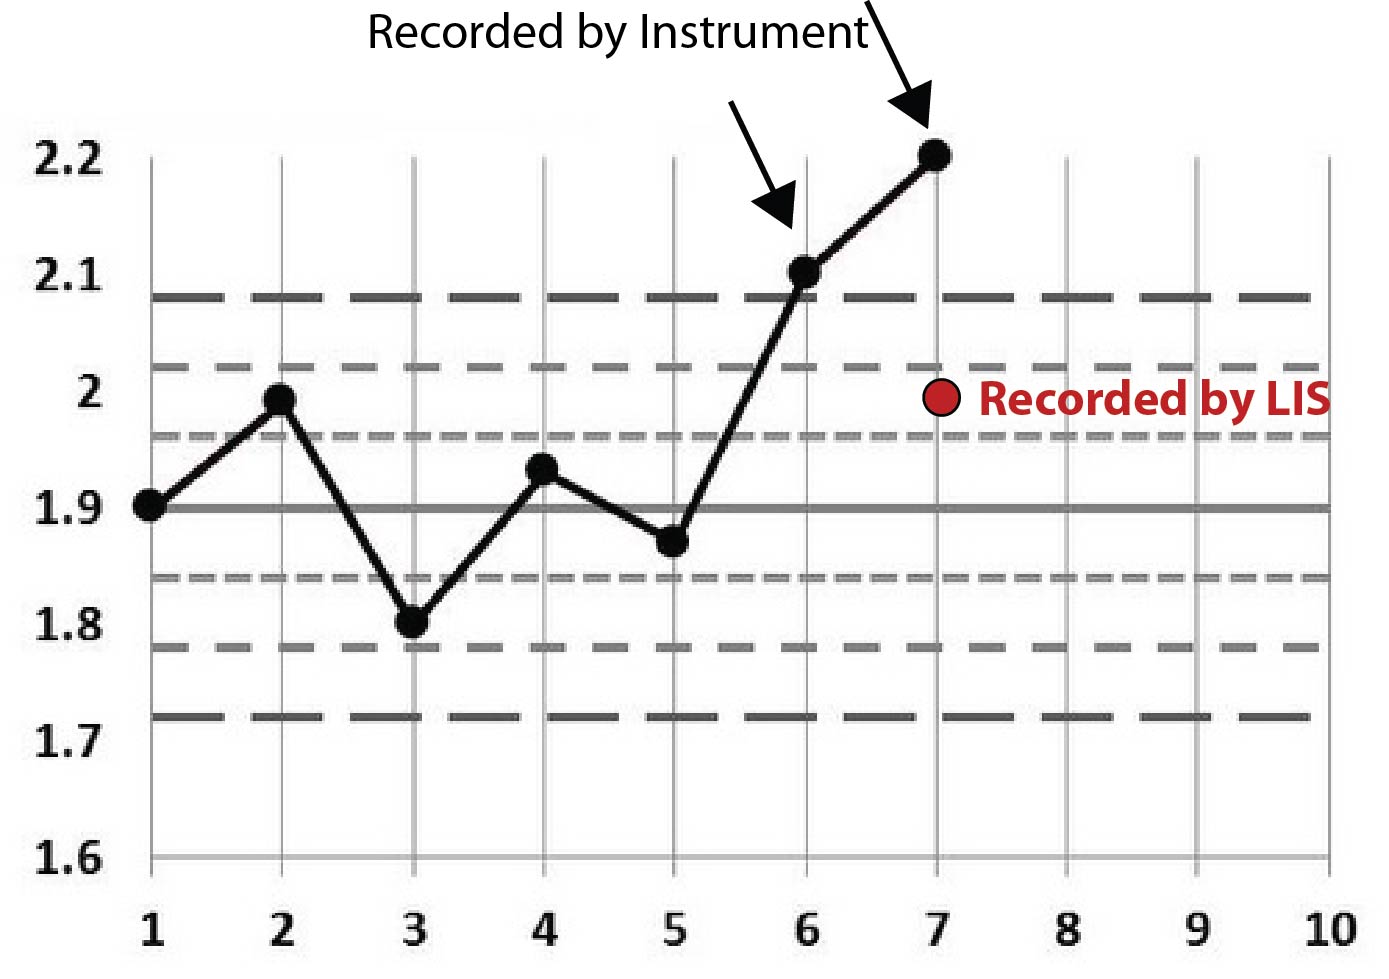
Here's the first Magnesium example:
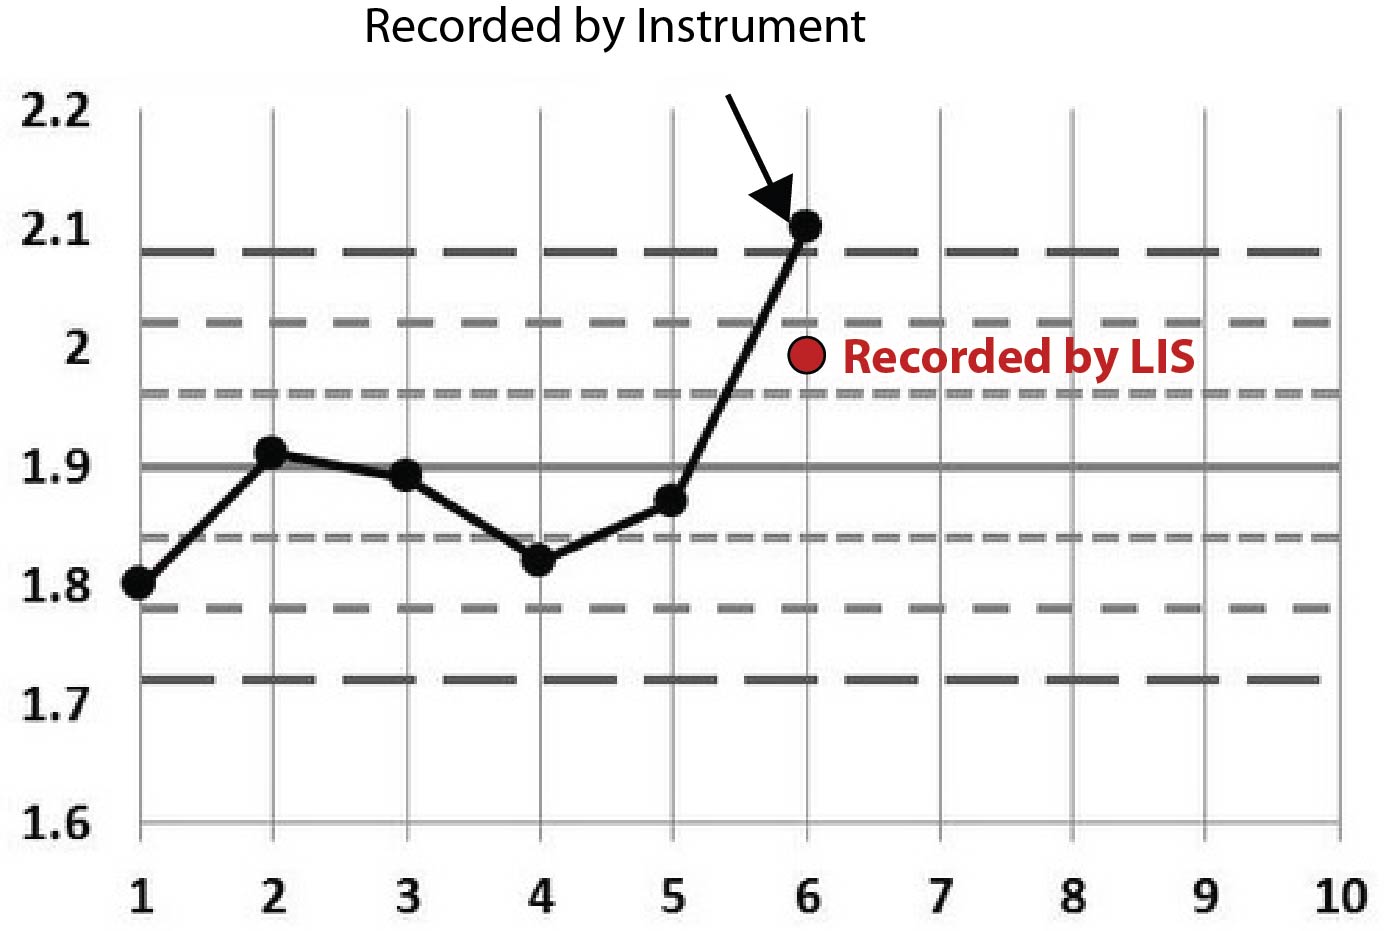
Here's the second Magnesium example:
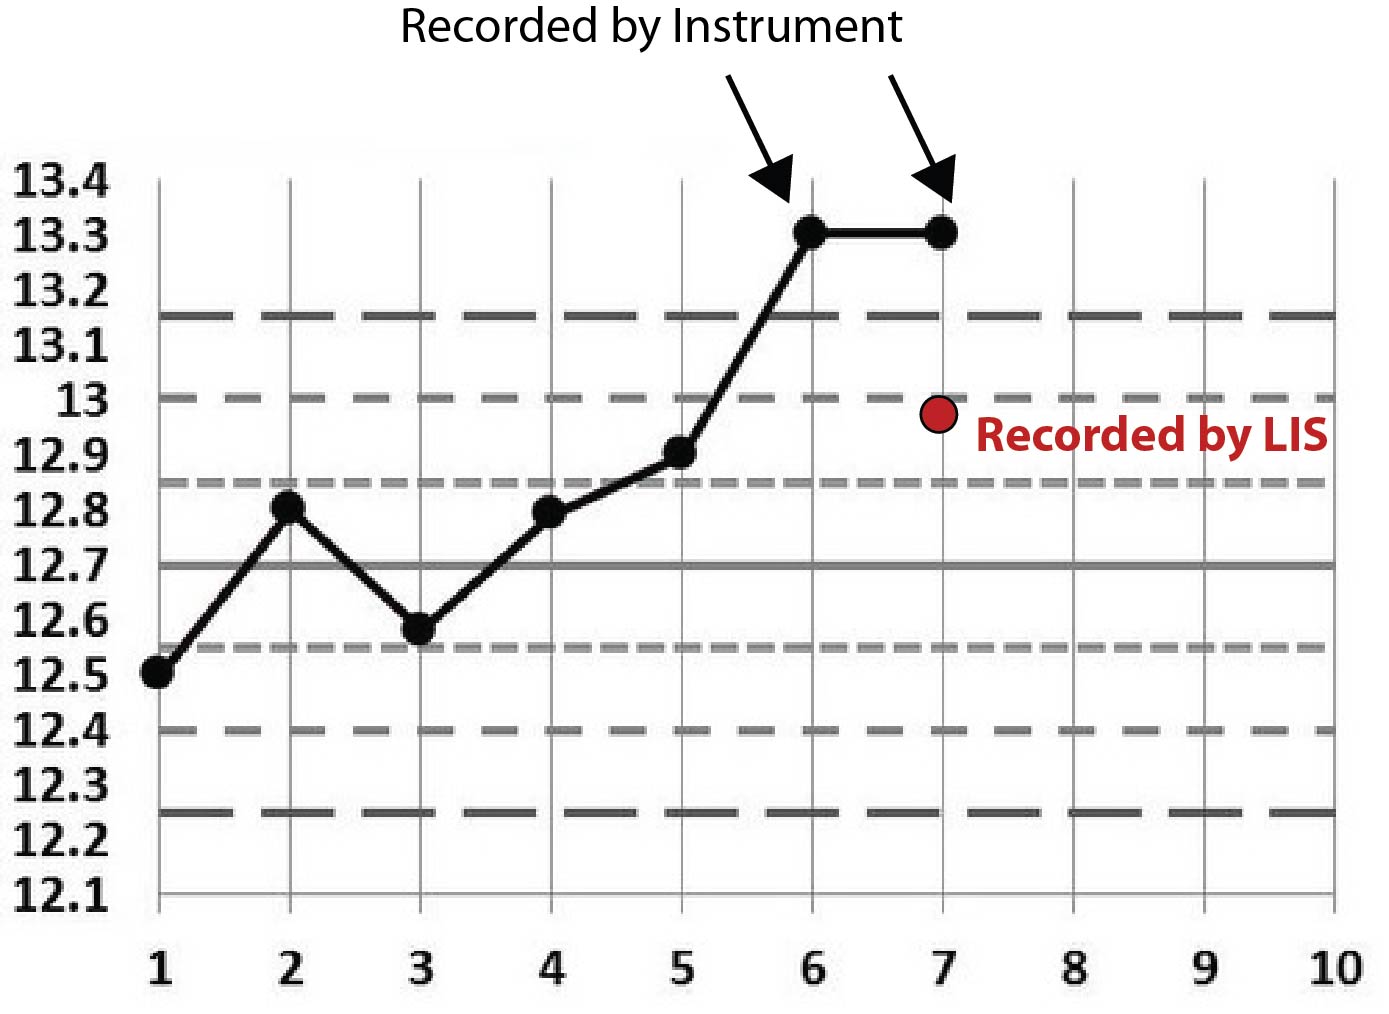
Here's a final example, this time with Calcium:
Perhaps the pattern is becoming a little clearer now. You can see that all the points recorded on the LIS are conveniently within the 2s control limit. Given that this 2s limit was being used as a rejection limit, that LIS value allowed results to go ahead and be reported.
One final clue: the LIS recorded the same employee ID for each of those incidents. That is, the instrument reported out-of-control values, then an employee went into the LIS and entered a value that was in-control.
Have you solved the mystery yet?
The employee was entering incorrect control data, overwriting the instrument controls at the LIS level, inserting a value that was just barely "in" control. That way all the results could be reported out and no more trouble-shooting, control repeating, re-calibrating, or other tech effort was required. This is the worst-case workaround: pretending everything is okay and letting (possibly bad) numbers out the door.
As you might suspect, once this employee's deeds were uncovered, they were summarily dismissed. In violation of all professional principles, the employee was circumventing the quality assurance of laboratory testing and potentially putting patients at risk. [For those of you who are worried, this laboratory did perform a retrospective patient review and did not find any significant changes to patient values.]
For me, this case raises two concerns: (1) how to properly monitor employee adherence to QC protocols, and (2) what has happened to our professional standards?
The first concern is actually easier to address. Indeed, the safeguards of this particular laboratory caught the error because it wouldn't let the employee fake or remove the data on the analyzer, and when the employee overrode the results at the LIS level, it couldn't be done without leaving their employee ID behind. In other words, this employee left their fingerprints all over the crime. There wasn't any way that an employee could get away with faking data without being eventually caught. But it takes a vigilant laboratory manager to check all the records and track these problems down.
More worrisome is the attitude that such an employee exhibits. Most laboratory professionals with decades of experience have a hard time imagining someone could be so negligent that they would outright falsify data just to get results out the door. Yet we have evidence that as many as 1 in 6 labs may be doing just this type of release. There are at least two forces to blame: the first is the crushing pressure of producing results as quickly as possible. Clinicians, usually wholly unaware of the complexity of testing, are quick to demand faster TAT and unsympathetic to problems with method stability and reliability. They just want their numbers and they assume they're always perfect.
The second problem is that some of our bad habits in QC have corrupted our behavior and corroded our own trust in the QC process. When we routinely respond to out-of-control QC results by repeating, repeating, and repeating controls until they fall back "in", the hidden message being delivered is that we don't need to listen to out-of-control results - we just need to trick the system back "in." It's not a very large step from repeating, repeating, and repeating, to simply changing the number. Both of them are workarounds. Both of them are ways to ignore the root cause of the problem and temporarily keep working. Ultimately, if we continue to corrode our trust and corrupt our QC, we will compromise patient results.
It's important to acknowledge the pressure that staff and lab management faces in today's workplace. For decades, the stress of having to do "more with less" has been building, and the unspoken priority communicated by many of the clinicians and administration officials is that, "what really matters is getting the numbers out the door quickly." Our entire healthcare system has created an environment where the pressure is on to just get the work done, one way or another. So let's be clear that we're not trying to insult anyone. At the same time, whenever anyone purposely changes data, that's not a mistake, a lapse, or an error. That's a deriliction of duty.
Conclusion
Without effective oversight this might not have been recognized until much later. One of the side effects of our down-sizing, de-skilling, stagnant wage environment is that we may get more employees who lack the professional knowledge and standards to do the right thing. Vigiliance will need to be heightened in order to maintain the proper level of quality assurance.
Employees also need to receive the appropriate training on the basics of quality control. Un-learning the bad habit of endlessly repeating controls until they fall "in" is one way to help stress the importance of getting the right value right the first time. If we let bad practices go uncorrected, they can fester and grow into even worse habits.