Quality Management
QC Selection Grids
James O. Westgard, Ph.D.
QC Selection Grids are quick planning guides for your single rule or multirule selection. If you know how often you have problems with a method (and you do know, don't you?) and can calculate the method's critical-error (we give you an online calculator to do it for you), then you can find out the best rule for your method.
- What is a QCSG?
- What is process capability?
- What is process stability?
- How can the QC Planning Process be adapted to use QC Selection Grids?
- Web toolkit for QC Selection Grids
- Example application for cholesterol
- QC Selection Grids vs. OPSpecs charts - Which is right? Which is better?
- References
In an earlier discussion on Starting a QC Planning Process, I suggested four possible approaches that would be practical to implement and easy to apply:
- Computer QC planning with the QC Validator program
- Manual QC planning with a workbook of OPSpecs charts
- Manual QC planning with normalized OPSpecs charts
- Manual QC planning with QC Selection Grids
The top three make use of charts of operating specifications (OPSpecs charts) that describe the imprecision and inaccuracy that are allowable and the QC that is necessary to assure a defined level of quality is achieved. The OPSpecs planning approaches are the most quantitative and easiest to use, but the hardest to understand. Therefore, some analysts may prefer the last approach - QC Selection Grids (QCSGs) - which makes use of tables of QC recommendations that are related to size and frequency of medically important errors, or the capability and stability of the testing process. These QCSGs were developed before OPSpecs charts and are less quantitative, therefore, careful application depends on using power function or critical-error graphs to verify that the performance of the tabulated QC procedure is appropriate for your situation. Analysts sometime find it difficult to perform this last step, thus QCSGs may not provide as reliable recommendations as those obtained from OPSpecs charts.
What is a QCSG (QC Selection Grid)?
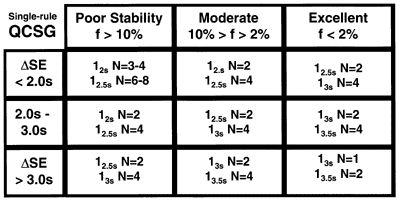 A QCSG is a 3 by 3 table that identifies control rules and Ns appropriate for nine different classes of methods. The rows of the table describe different levels of analytical performance, or process capability. The columns of the table describe how often a method has problems, or process stability. A user determines the process capability and stability for a method, identifies candidate QC procedures from the QCSG table, then examines power function graphs or critical-error graphs to verify QC performance and make a final selection.
QCSG's have been prepared for both single-rule and multi-rule QC procedures [1]. The single-rule QCSG shown here includes rules with control limits of 2s, 2.5s, 3s, and 3.5s (i.e., control rules 12s, 12.5s, 13s, and 13.5s, resp.) and with N's that vary from 1 to 6. There are 2 or more choices in each category and the rules with the wider limits are seen to require higher Ns. The lower right corner shows the best situation where a method that has very good analytical performance - small SD and low bias - and is very stable - few problems that need to be detected, thus the control limits are wide and the Ns are low to minimize false rejections. The upper left corner shows the worst case, where the analytical performance of the method is marginal and analytical problems are expected to be frequent, thus the control limits are narrow and the Ns are high to maximize error detection.
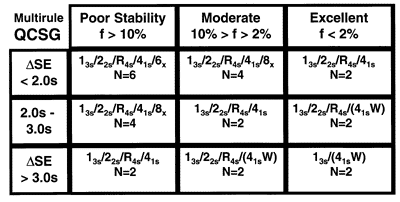 The QCSG shown here for multirule QC procedures is intended for use with 2 control materials per run, therefore, the control rules considered are 13s, 22s, R4s, 41s and 6x and the Ns considered are 2, 4, and 6. Again, the lower right corner represents the best case where the number of rules and number of measurements are lowest; the upper left corner is the worst case where the number of rules and number of measurements are highest. Moving from the lower right to the upper left, the QC recommendations show increases in both the number of rules applied and the number of control measurements to be made.
What is process capability?
Process capability is an industrial term for describing the ability of a production process to produce the required quality. The relationship between the quality requirement and the process variation and bias can be quantified by calculating a process capability index. Our calculation of a critical systematic error (![]() SEcrit)is equivalent to the industrial process capability indices such as Cp [2] and Cpk, as discussed recently by Chester and Burnett [3]. Thus, the following equation is used to calculate the value for process capability in the QCSG:
SEcrit)is equivalent to the industrial process capability indices such as Cp [2] and Cpk, as discussed recently by Chester and Burnett [3]. Thus, the following equation is used to calculate the value for process capability in the QCSG:
![]() SEcrit = [(TEa - biasmeas)/smeas] - 1.65
SEcrit = [(TEa - biasmeas)/smeas] - 1.65
where TEa is the allowable total error, biasmeas is the observed inaccuracy of the method, and smeas is the observed imprecision of the method.
What is process stability?
Process stability refers to the frequency of occurrence of medically important errors, e.g., how often does the method have problems that cause errors as large as the critical systematic error (calculated above). We all know that methods have become more and more stable with newer generations of analyzers, and somehow that should affect how we manage and control those analyzers.
The influence of frequency of errors on QC design can be assessed from a predictive value model that shows how the quality (defect rate) and productivity (test yield) of a testing process depend on the probabilities of error detection and false rejection of different QC procedures [4]. If ideal QC performance can be attained, i.e., both high error detection and low false rejection, then the QC procedure provides optimal performance for any frequency of errors. When ideal QC performance cannot be attained, then the priority should be on high error detection when there are frequent problems and low false rejection when there are few problems to detect.
These insights are also the basis of the strategy to use multi-stage QC procedures to have the best of both worlds by switching back and forth between high error detection and low false rejection designs. For example, with large automated analyzers, it may be desirable to use a high error detection design for the initial "startup" of the analyser, then switch to a low false rejection design to "monitor" performance during routine operation.
Quantitative estimates of the frequency of errors are seldom available, particularly when considering new analytical methods. Until such information can be provided from carefully constructed QC databases, a qualitative judgment will be necessary based on the experience in your laboratory. It should be sufficient to classify those "bad" methods as having "poor stability," those reliable methods as having "excellent stability," and those in between methods as having "moderate stability."
How can the QC planning process be adapted to use QCSGs?
Earlier directions [1] for using QCSGs did not include a step for identifying a TQC strategy, however, our eight-step QC planning process can be adapted for use with QCSGs as follows:
- Define the quality requirement of the test as a total allowable error (TEa) at a medical decision level (Xc).
- Determine the imprecision (smeas) and inaccuracy (biasmeas) for your analytical method.
- Calculate the critical systematic error from the equation:
 SEcrit = [(TEa - biasmeas)/smeas] - 1.65
 - Categorize the stability of the method as excellent, moderate, or poor.
- Select the row of the QCSG based on the value of SEcrit, select the column of the QCSG based on the expected stability, then look up the candidate control rules and Ns.
- Verify the performance of the candidate QC procedures by determining the probabilities for error detection and false rejection from power function or critical-error graphs, then select the final control rules and N to be implemented.
- Identify an appropriate TQC strategy based on the expected error detection.
- Reassess for changes in method performance, i.e., repeat the QC Planning Process whenever there are improvements or degradations in method performance.
Cholesterol example application
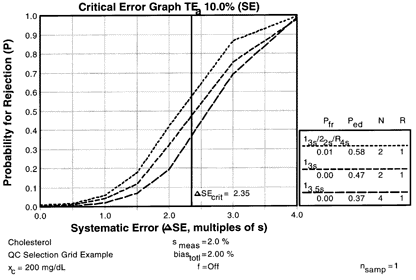 Consider my old favorite cholesterol method that has a CV of 2.0%, a bias of 2.0%, and a CLIA PT criterion of 10%, where the critical systematic error is calculated to be 2.35 [{(10-2)/2}-1.65]. If the expected stability were "excellent," then the candidate QC procedures are identified in the QCSGs by the intersection of the middle row (
![]() SE 2.0s - 3.0s) and the far right column (Excellent, f<2%). In the single-rule QCSG, the candidates are the 13s with N=2 and 13.5s with N=4. In the multi-rule QCSG, the candidate is 13s/22s/R4s with N=2.
SE 2.0s - 3.0s) and the far right column (Excellent, f<2%). In the single-rule QCSG, the candidates are the 13s with N=2 and 13.5s with N=4. In the multi-rule QCSG, the candidate is 13s/22s/R4s with N=2.
The power curves for these QC procedures show that the critical systematic error would be detected 58% of the time by the multirule procedure, in comparison to 47% and 37% for the 13s and 13.5s single-rule procedures, resp. The false rejection rates are 1% or less for all three candidates. Thus, the multirule procedure with N=2 would be the best selection here to provide moderate error detection with low false rejection. A balanced TQC strategy would be appropriate and it would be desirable to make some improvement in method performance, particularly reduction of method bias, to achieve a more controllable and better managed testing process.
QCSGs vs OPSpecs
Comparison of the QCSG approach with the OPSpecs approach (see earlier QC planning application for cholesterol with analytical quality requirement) shows that different QC procedures will be selected by these different QC planning tools. The OPSpecs approach leads to a 13s/22s/R4s/41s multirule with N=4, whereas the QCSG gives a 13s/22s/R4s multirule with N=2.
Which is right? According to the directions, both have been selected correctly, thus both are right. But the answers are indeed different! Keep in mind that OPSpecs charts were developed after QCSGs and the objective was to get a more quantitative planning tool that would build-in the desired error detection rather than verifying QC performance after selecting a limited number of candidate QC procedures. Therefore, the real question should be which provides the better QC procedure to manage the testing process.
Which is better? The multirule procedure with the higher N will provide nearly 90% detection of the critical systematic error, compared to about 60% for the lower N, but also increases false rejections from 1% to 3%. Is it worth paying the cost of two more control measurements and two percent more false rejections to gain the 30% increase in error detection? That's a management decision that you have to make. If it were your specimen being submitted for analysis, how would you want the laboratory to be managing the quality of its testing process? I would select the higher N multirule procedure to assure test quality for your specimen as well as my own.
References
- Westgard JO, Qualm EF, Barry PL. Selection grids for planning quality control procedures. Clin Lab Science 1990;3:271-278.
- Westgard JO, Burnett RW. Precision requirements for cost-effective operation of analytical processes. Clin Chem 1990;36:1629-32.
- Chester D, Burnett L. Equivalence of critical error calculations and process capability index Cpk. Clin Chem 1997;43:1100-1101 (letter).
- Westgard JO, Groth T. A predictive value model for quality control: Effects of the prevalence of errors on the performance of control procedures. Am J Clin Pathol 1983;80:49-56.