Z-Stats / Basic Statistics
Z-10: ANOVA
ANOVA. No, this isn't a PBS show, it's the analysis of variance. While this is the statistician's passion, it's a bit less thrilling for laboratory personnel. Dr. Zady simplifies the topic and makes it easier to understand and implement ANOVA in a healthcare situation.
The Analysis of Variance
EdD, Assistant Professor
Clinical Laboratory Science Program, University of Louisville
Louisville, Kentucky
January 2000
In Lesson 9, the effects of experimental factors on a test of significance were discussed, particularly the difficulties with the choice of the alpha level and the size of N. There is yet another difficulty related to the alpha level when more than two methods need to be compared. For example, suppose a researcher decided to test several different levels of antibiotics. Could you use a t-test to compare each experimental group to the control group. The answer is yes, but each time another t-test is performed, the alpha level will increase above the 0.05 limit, which makes it more difficult to judge whether there is a significance difference between the groups.
You may be more familiar with a similar difficulty that occurs in laboratory QC when more than one control material is analyzed or more than one control observation is collected. When a control chart has control limits set as the mean plus and minus 2 standard deviations, this is comparable to a test of significance at an alpha level of 0.05, i.e., a 5% false rejection rate is expected when a single control material is analyzed or a single control observation is collected. If two different materials are analyzed or two control measurements collected and both are compared to 2 SD limits, the false rejection rate increases to almost 10%; with three control materials or three observations, the false rejection rate increases to about 14%. In effect, alpha level that was set as 0.05 applies only to a single application of the test of significance. Multiple applications will increase the chance of rejecting the null hypothesis when no difference exists (i.e., will cause false rejections).
In this lesson, we'll focus on the application of a test of significance to an experiment with more than two groups and describe a statistical procedure that holds the alpha level constant and uses the F distribution and F-test. You can learn more about the QC application from Dr. Westgard's lesson on QC - The Chances of Rejection.
F-test and ANOVA
In the organizer that was introduced in Lesson 2, we saw that when we moved from Step 5 (t-test) to Step 6 (F-test) we "dropped the square root" term. When calculating t we always divided the difference values by an error term that was a square root. With the F-test, we no longer use the square root term. F represents the square of t or F= t². Therefore, if a t-value of 2.00 (1.96) or greater was needed to reject the null hypothesis at a probability of 0.05, it follows that an F value of 4 has about the same 0.05 probability. This is an approximation because the F-distribution is non-normal; for more exact values, tables of F-values can be used.
The F-test is a measure of variance, and we use it for an Analysis of Variance commonly called ANOVA. Recall from Lesson 5 that variance is the sum of squared differences from the mean averaged over N or:
variance =  (value-mean)²/N= SS/N
We also learned that the SD is calculated as the square root of this variance term (remember raising a number to the 1/2 power is the same as taking its square root:
SD = (variance)1/2 = (SS/N)1/2
Now if we don't go through the mathematical step of taking a square root, i.e. we "drop the square root" as described in the organizer, we are actually working with variance. The simplest analysis of variance is called one-way ANOVA, and that is what we will consider next.
One-way ANOVA
ANOVA is a method that can be used to analyze the variance of several experimental variables (independent variables) or several levels on one variable (independent variable) while maintaining the alpha level. In ANOVA procedures, the independent variables can be category designations or categorical (discontinuous) such as antibiotic or no antibiotic. The dependent variable such as the number of days of life span are considered to be a metric (continuous) variable. In ANOVA, the dependent variable is always a metric like number of days or results of a test.
Expanding the antibiotic experiment that was discussed in lesson 7, suppose instead of just giving antibiotic or no antibiotic, the experimenter decided to give three different levels of antibiotic (still a categorical variable) to see if any particular dosage is more effective. There are now three levels on the independent variable, and they are the three mouse groups. Group 1 has low level antibiotic; Group 2 has medium level antibiotic; and Group 3 has high level antibiotic. The t-test can no longer be used because there are more than two groups. The situation calls for the simplest ANOVA, a one-way ANOVA, sometimes called procedure ONEWAY. The null hypothesis for the three groups or levels in the above situation would be: Ho: µLOW = µMED = µHI
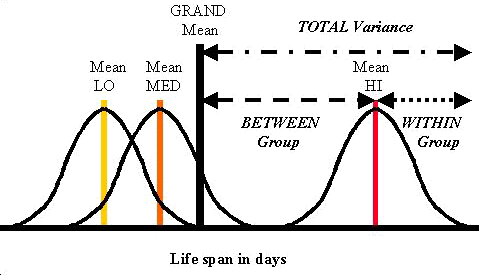 The results of the experiment are shown in the figure. Here we see the three group distributions. The LO and MED distributions are closer together than the HI distribution. Does this mean that HI is significantly different? How do we go about making any conclusions? The purpose of the ANOVA is to show whether or not there are differences in the means of the three groups. As with the other statistical tests that we have covered thus far, there is a typical flow of mathematical logic. Basically, we are going to determine an overall or grand mean for all three groups and then judge how different each of the individual means is from the grand mean.
Determining the grand and group means
Adding all of the values for life-span days and averaging over the number of mice in all groups produces the overall or grand mean or Xbar grand mean or XGM. To determine the individual group means, the values within each group are summed and divided by their respective N's. In figure above, the tallest vertical line shows the grand mean and the vertical lines within the distributions show the individual means.
Partitioning the variance
How do we determine whether any of the group means are different from the grand mean? Right now we are only going to consider the HI group. Find the HI group distribution in figure above. Look at the highest HI score in the right-hand tail of the HI distribution. The relationship between this value and the GM (grand mean) is described by the "total variance" which is made up of a "within group" variance and a "between group" variance.
- TOTAL VARIANCE describes the relationship between the GM (grand mean) and the highest HI score in the right-hand tail of the HI distribution, and can be estimated as = S(X-XGM)². It can be seen as the longest dotted line in the figure above;
- WITHIN GROUP variance of the HI group, which is shown by dashed line between the highest HI value and the mean of the HI distribution, can be estimated as HI variance = S(X-XbarHI)² ;
- BETWEEN GROUP variance, which is shown by the dotted line depicting the distance between the grand mean and the mean of the HI group, can be estimated as = S(XbarHI-XGM)².
Determining the components of variance
We have only worked with the HI group so far. We would need to perform the same calculations for the LO and MED groups because the final estimates of the components of variance come from all three groups (i.e., K=3 in our example of testing three levels of antibiotics). The table below provides a summary of the one-way ANOVA calculations.
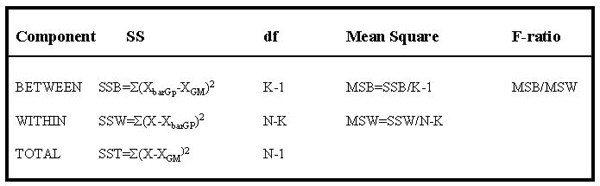
- The BETWEEN GROUP variance is shown in the first row. It is calculated by subtracting the grand mean (GM) from the group mean (GP) for HI, MED, and LO groups, squaring the differences, and summing them to produce a sum of squares term for between groups (SSB). This SSB term is divided by K-1, where K is the number of groups (3 in this case), to provide a variance term, labelled MSB for the Mean of Squares Between groups, which represents the variance between groups.
- The WITHIN GROUP variance is shown in the second row of the table. It is derived from the sum of squared differences from the mean (SSW) of the HI group values (for example) averaged over N-K, where N represents the number in each group. Again this is a typical variance calculation and the new term is called MSW or Mean of Squares Within, here referring to the HI group. The term is sometimes called residual or error sum of squares (SSE).
- The TOTAL VARIANCE is shown in the last row. The df's associated with it are all the N's added together minus one. This term is sometimes called SST or TSS or total sum of squares.
Comparing variances using an F-test
The F-test statistic is calculated as the ratio of the MSB divided by the MSW, i.e., Fcalc=MSB/MSW, as shown by the far right column in the table above. Just like for the t-test, the critical F-value is found from a table given the df's (degrees of freedom). If Fcalc is greater than Fcrit then the Ho is rejected, and the means of one or more groups are different (here it would be the HI group). If Fcalc is less than Fcrit then Ho stands. The groups are not significantly different.
Computer programs will often print the calculated F-value and an associated probability. For example, if the calculated F-value is greater than 4.0 and alpha was set as 0.05, the F probability would be given as less than 0.05, which indicates that the means of the three groups are "not the same." Remember in experimental design the approach is to reject the null hypothesis (i.e., the assumption that there is no difference). If Fcalc was less than Fcrit, the result would indicate that the different levels of antibiotic had the same outcome (statistically speaking) and Ho would be retained. The F-probability would be given as greater than 0.05.
Notes and Precautions
This introduction to ANOVA has focused on the concept of analyzing the differences between experimental groups by partitioning the overall or total variance observed into within group and between group components. The mathematics provided are the minimum needed to understand the application and the statistical terms that are critical for interpreting the results.
- Which group is different? When there are more than two groups in the experimental design, it becomes difficult to determine just which group(s) is different. In this example, the difference between HI group and the rest of the population or GM has been emphasized. Remember that procedure ANOVA compares all group means examining the between versus the within group variance and signals that there are differences, BUT it does not tell which groups are different. There are additional statistical tests, such as the Tukey and Sheffe tests, that can be used to determine which groups are different.
- Practical significance of observed differences. In prior discussions, we noted that if N is large enough, statistical tests may show that small differences are statistically significant, even though those differences may not have any practical significance. Given large sample size, both t and F testing are affected in this way.
- Error terminology. The WITHIN group variance component is often called the residual sum of squares or the error sum of squares. The dispersion or variance WITHIN a group constitutes a source of error in the sense that this amount of variation will limit the experiment's capability for detecting small changes. We can think about this as dividing through by the error term to find out where we stand in reference to the gates on the F distribution.
- Assumptions. As in most statistical testing, there are certain basic assumptions which should not be violated: a) the samples must be random and independent; b) the distribution should be normal; and c) the variance should be equal for each group. The statistical procedure is robust with respect to the normal distribution, which means that violating this assumption may not be all that problematic. The statistical procedure is only minimally susceptible to unequal variance as long as the N of each group is the same.