Six Sigma Basics: Outcome Measurement of Process Performance

James O. Westgard, Ph.D.

Six Sigma Quality Management provides a general goal for process performance - six sigmas of process variation should fit within the tolerance limits or quality requirement for the product. Given this goal, it is important to measure process performance to determine whether improvement is needed. There are two different methodologies - one based on counting the defects produced by the process (an outcome measure) and the other based on measuring the variability of the process directly (a predictive measure).

Two Approaches for Measuring Process Performance

The two approaches are illustrated in the accompanying figure. The first approach is based on the measurement of the outcome of the process, whereas the second is based on measurement of the variation of the process. The outcome measurement approach is applicable to any process, but usually requires extensive efforts to collect and analyze the data. Direct measurement of process variability allows for determination of process capability. This approach assumes a process whose distribution is stable and can be characterized by repetitive measurements. This second approach is more limited in application, but is advantageous in order to plan, design, evaluate, and optimize process performance prior to routine operation and production.

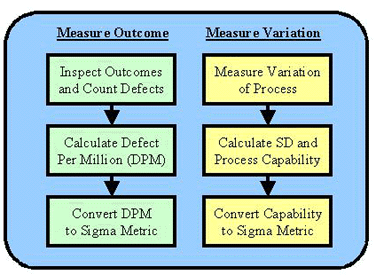
This lesson is about the first methodology that inspects the output of the process, estimates the defect rate in terms of defects per million (DPM), then converts the defect rate to a sigma-metric to characterize process performance.

A Well Known Example

A well-known tire manufacturer produced 6,000,000 tires for a particular brand of sports utility vehicle. It was reported that there have been 2000 accidents and 100 deaths due to failures of the tires. What's the performance of the production process?

Step 1. Inspect the data to determine the number of defects. In this case, a defect should be defined as a tire that causes an accident. The severity of the accident determines the number of deaths.

Step 2. Calculate the defects per million (DPM). There were 2000 accidents observed in those vehicles equipped with 6,000,000 tires.

Step 3. Convert from DPM to a sigma metric using a standard table from one of the Six Sigma texts. Here's a short version of such a table.

Sigma Metric DPM without shift DPM with 1.5s shift
1.00 317,400 697,700
2.00 45,400 308,637
2.50 12,419 158,686
3.00 2,700 66,807
3.50 465 22,750
4.00 63 6,210
4.50 6.8 1,350
5.00 0.57 233
5.50 0.038 32
6.00 0.002 3.4

The production of these tires falls short of the six-sigma goal for process performance, regardless whether the conversion is based on DPM without shift or DPM with 1.5s shift. However, the process does perform at approximately the 5 sigma level using the conversion based on a 1.5s shift.

DPM Conversion Table

Every Six Sigma text includes a table for converting DPM to a sigma metric, such as the one linked at the end of this lesson.

The nomenclature often varies from table to table. Some tables used the terms Defects Per Million Opportunties (DPMO) and parts per million (ppm), and some tables give the figures in terms of percentages that can be related to process yield or percent within specifications, as well as percent defectives. The sigma-metric is variously referred to as sigma, sigma value, process sigma level, sigma level, and sigma quality level.

The tables often contain two sets of conversions, one that corresponds to the defect rate that would be observed if the process were to shift as much as 1.5 sigma, and the other corresponding to the defect rate expected if the process were properly centered. These two distributions are shown in the accompanying figure. The tabulated values in the conversion tables correspond to right half of the distribution curves, with the DPM values from the y-scale being tabulated versus the sigma values on the x-scale. It is obvious that the conversion based on the shifted distribution gives higher values for the sigma metric than that from the centered distribution.

The rationale for using a 1.5s offset is discussed by Harry and Schroeder [1]:

"By offsetting normal distribution by a 1.5 standard deviation on either side, the adjustment takes into account what happens to every process over many cycles of manufacturing… Simply put, accommodating shift and drift is our "fudge factor," or a way to allow for unexpected errors or movement over time. Using 1.5 sigma as a standard deviation gives us a strong advantage in improving quality not only in industrial process and designs, but in commercial processes as well. It allows us to design products and services that are relatively impervious, or "robust", to natural, unavoidable sources of variation in processes, components, and materials."

Strictly speaking, it is more rigorous to use the "centered" conversion, but it is more common to use the conversion that allows for a 1.5s shift. So common, in fact, that some of the Six Sigma texts only provide a conversion table that allows for the 1.5s shift. A more obvious reason for favoring that conversion is that process performance always looks better, i.e., the sigma-metric will always be higher. Harry and Schroeder explain the difference between the two measures as follows [2]:

"So when companies claim that their processes are at six sigma, what they are really saying is that the short-term capability of their processes is six sigma; the long-term performance, however, is 4.5 sigma because of process centering errors."

The difference between the two conversions is important in applications in healthcare laboratories. Outcome measures of process performance may not be consistent with the predictive measures used in process design. To be consistent between the measurement of process performance via outcomes or via predictive performance characteristics (i.e., direct estimation of the standard deviation of the process), it would be preferable to use the "centered" conversion.

Laboratory Performance Indicators as Outcome Measures

The use of outcome measures to characterize the performance of laboratory related processes has been illustrated by Nevalainen et al [3] in what appears to be the first paper (April, 2000) published on Six Sigma Quality Management in the laboratory medicine literature. The authors analyzed data from three individual laboratories, as well as summaries of performance from 300 to 500 laboratories participating in the College of American Pathologist's Q-Probe program. The original paper provides information on sample size and the number of defects or errors, which were then converted into percent errors and defects per million. DPM figures for representative quality indicators from the Q-Probe data are converted to sigma values in the tables below.

Q-Probe QUALITY INDICATOR % ERROR DPM SIGMA*
Order accuracy 1.8 % 18,000 3.60
Duplicate test orders 1.52 15,200 3.65
Wristband errors (not banded) 0.65 6,500 4.00
TDM timing errors 24.4 244,000 2.20
Hematology specimen acceptability 0.38 3,800 4.15
Chemistry specimen acceptability 0.30 3,000 4.25
Surgical pathology specimen accessioning 3.4 34,000 3.30
Cytology specimen adequacy 7.32 73,700 2.95
Laboratory proficiency testing 0.9 9,000 3.85
Surg path froz sect diagnostic discordance 1.7 17,000 3.60
PAP smear rescreening false negatives 2.4 24,000 3.45
Reporting errors 0.0477 477 4.80
*Conversion using table with allowance for 1.5s shift

As shown by the variety of preanalytic, analytic, and postanalytic processes in this table, the approach of using outcome measures can be applied to virtually any process. The observed error rates for several of these processes are in the 3.0% to 0.3% range, which translates to typical sigma levels of 3 to 4. Even analytical performance, as estimated from proficiency testing data, is only at the 3.85 sigma level. The best process is "reporting errors" which has a sigma metric of 4.80. No process achieves the six sigma goal.

Benchmarks for Process Performance

To provide some perspective on the observed sigma-metrics for production processes, a number of benchmarks are often cited:

With respect to these benchmarks, laboratory processes are seen to approach average performance of business processes. Opportunities for improvement abound! Achieving 5 sigma performance would be a significant improvement for most laboratory processes.

However, the typical perspective in the healthcare setting is that the observed quality is good enough, given the cost-control environment, demanding work conditions, overloaded workers and managers, and burden of regulatory requirements [4]. The "we are different" attitude still prevails, as shown by the statement "I'm not sure it's reasonable to expect laboratories to achieve the same defect rate as activities such as baggage handling." It isn't - we should do better!

Measurement Considerations

It appears to be simple procedure to count defects or errors and convert them to a sigma-metric for process performance. However, the design of the experiment, collection of data, and the analysis of that data are still critical.

What's a defect? It's critical to define a defect or error. Remember the recent national dilemma concerning the presidential vote in Florida and the difficulty of defining a defective ballot or vote. Similar things have happened in the laboratory. One widely quoted study about the frequency of laboratory errors was a review of 363 incidents captured by the hospital's quality assurance program [5]. Pre-analytic mistakes accounted for 45.5% of those incidents, analytic errors accounted for 7.3%, and post-analytic for 47.2%.

The study reported that the overall defect rate was 37.5 per 100,000, or 375 DPM, which corresponds to an approximately 4.9 sigma process. Considering that this measure of performance would be affected by all the pre-analytic, analytic, and post-analytic factors discussed earlier, the overall performance of the laboratory testing process in this hospital far exceeds the sigma-metrics observed in Q-Probe studies. Is laboratory testing that much better in this hospital? Is it possible that "incidents" are not a reliable way to count defects? Do you think that the accidents reported for Firestone tires on Ford Explorer vehicles identified all the defective tires?

What sample size is needed? We sample 100 units and find 1 defect, which gives a 1% defect rate or 10,000 DPM or 3.8 sigma process performance. Would it be better to sample 1000 units or 10,000 units or 100,000 units? Of course! But, given the cost of sampling, is it necessary to sample 100,000 units?

One way to see the importance of sample size is to determine the confidence interval for an estimated proportion. This can be done by calculating the standard deviation from the expression (pq/n)1/2, where p is the proportion, q is 1-p, and n is the sample size [6]. An approximate 95% confidence interval can be described by taking the range p+2s to p-2s. For a process that has a true defect rate of 1% or 0.01 proportion defective, the confidence intervals would be as follows:

Clearly a sample size of 100 is not sufficient to properly characterize the sigma capability of the process. A sample size of 1000 gets us close. A sample size of 10,000 nails it down pretty solid. A sample size of 100,000 isn't necessary.

Are there alternative measures to DPM? The DPM parameter is most commonly used to describe the quality per unit of product. In situations where there may be several quality attributes that could result in a defect for a given unit, the number of quality attributes are multiplied by the number of units to express defects per million opportunities (DPMO). In measuring the outcome of many healthcare processes, DPMO may be the better measure to take into account the many dimensions of quality that impact the outcome.

For industrial processes, it is also common to describe process performance in terms of yield [7]. For example, a process with a 1% defect rate would provide a yield of 0.99 (yield = 1 - proportion defective). The yield of sub-processes may be measured, often called first pass yield or throughput yield. The expected outcome of a process can be calculated by combining the yields of the sub-processes to give what is variously called a final yield, rolled yield, or rolled throughput yield. Some conversion tables include % Yield and DPMO as the measures to be converted to a sigma metric.

What's the point?

Six Sigma Quality Management provides a general methodology for measuring the outcome of any process and using that data to characterize process performance. The measure is the number of defective units, services, or results, expressed per million. Standard tables are available in all Six Sigma texts to convert the measured DPM to a sigma-metric that describes the performance of the process. This is a powerful methodology that applies to virtually any kind of process. The drawbacks are that:

Fortunately for analytical testing processes, there are direct measures of process performance that can be used to predict the outcome and plan the processes to produce the desired quality. However, for other service processes in the laboratory, the measurement of outcomes will be essential to characterize the performance of the processes.

References

  1. Harry M, Schroeder R. Six Sigma: The Breakthrough Management Strategy Revolutionizing the World's Top Corporations. New York:Currency, 2000, page 144.
  2. Ibid, page 143.
  3. Nevalainen D, Berte L, Kraft C, Leigh E, Morgan T. Evaluating laboratory performance on quality indicators with the six sigma scale. Arch Pathol Lab Med 2000;124:516-519.
  4. Sarewitz SJ. Letter in response to Evaluation laboratory performance with the six sigma scale. Arch Pathol Lab Med 2000;124:1748.
  5. Ross JW, Boone DJ. Assessing the effect of mistakes in the total testing process on the quality of patient care. Proceedings of the 1989 Institute on Critical Issues in Health Laboratory Practice. Centers for Disease Control, Atlanta, GA, 1991, page 173.
  6. Davies OL, Goldsmith PL. Statistical Methods in Research and Production. New York:Hafner Publishing Company, 1972, page 309.
  7. Pande PS, Neuman RP, Cavanagh RR. The Six Sigma Way: How GE, Motorola and Other Top Companies are Honing Their Performance. New York:McGraw Hill, 2000, pp 229-231.

Other Six Sigma articles:

Six Sigma DPM Table

Six Sigma Quality Management

Six Sigma and Requisite Laboratory QC

Six Sigma Basics: Process improvement, goals, and measurements