QC Design
Potassium
A simple example planning QC for potassium using power function and critical-error graphs.
A simple example using power function and critical-error graphs
Note: at this time this was written, QC Validator was the QC Design software available. Validator has been replaced by EZ Rules 3, which has all the features and capabilities of the earlier version, as well as new enhancements.
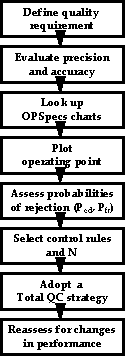
A systematic planning process can be used to select QC procedures for tests in your laboratory. We recommend the 8-step process shown in the accompanying figure. This QC planning process allows you to select control rules and numbers of control measurements (N) to monitor individual tests on the basis of the quality required by the test, the observed accuracy and precision of a method in your laboratory, and the expected error detection and false rejection characteristics of the QC procedure itself. At first, this planning process will seem formidable, but with practice it will become quick and easy to do. We'll illustrate the QC planning process for a potassium test to demonstrate the step-by-step process. In this example, we emphasize the use of power function and critical-error graphs. We'll demonstrate the use of charts of operating specifications (OPSpecs charts) in other QC planning applications.
- 1. Define the Quality Requirement
- 2. Evaluate the accuracy and precision of the method
- 3. Calculate the critical-sized errors
- 4. Obtain power function graphs
- 5. Assess the probabilities for rejection
- 6. Select the control rules and numbers of control measurements
- 7. Adopt a Total QC Strategy
- 8. Reassess for changes in performance
 1. Define the quality requirement.
Potassium is a regulated test, which means that CLIA has designated this test to be monitored by an external proficiency testing (PT) program and has defined a criterion for acceptable performance of 0.5 mmol/L at the Target Value of interest. (See the CLIA list of regulated analytes and performance criteria.) This CLIA PT criterion represents the allowable total error for the test, i.e., all errors should be less than 0.5 mmol/l, whether random, systematic, or a combination of the two. At a Target Value that corresponds to a medical decision level of 5.0 mmol/L, the CLIA PT criterion of 0.5 mmol/l amounts to an allowable error of 10%.
2. Evaluate the accuracy and precision of the method.
From initial method validation studies, a replication experiment shows a standard deviation of 0.075 mmol/L at a level of 5.0 mmol/l, which gives to a coefficient of variation (CV) of 1.5% [(0.075/5.0)*100= 1.5]. The bias observed from a comparison of methods study is 0.10 mmol/L at 5.0 mmol/L, which amounts to 2.0% bias.
3. Calculate the critical-sized errors.
The critical-size systematic error (?SEcrit) that need to be detected by a QC procedure to maintain the 10% quality requirement can be calculated from the following equation: ?SEcrit = [(TEa - biasmeas))/smeas] - 1.65 where TEa is the allowable total error quality requirement, biasmeas is the observed inaccuracy of the method, and smeas is the observed imprecision of the method. For our potassium example, ?SEcrit = [(10-2)/1.5] - 1.65 = 3.68 which means that the QC procedure needs to be able to detect a systematic shift that is equivalent to 3.68 times the standard deviation of the method.
Note that while you can calculate these figures manually, the EZ Rules 3 program will calculate the critical-errors automatically as soon as you enter the initial parameters.
4. Obtain power function graphs.
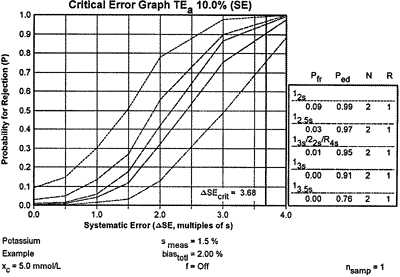
We need to know the performance available from commonly used single and multirule QC procedures. This information is available in the form of power function graphs that describe the probability of rejecting a run as a function of the size of error occurring in the run. These graphs are available in the scientific literature and Westgard QC's OPSpecs® Manual, and they can also be prepared by the EZ Rules 3 or Validator® computer program. For example, the accompanying figure shows the power curves for commonly used control rules with N's of 2 per run. Note that probability for rejection is plotted on the y-axis and the size of the systematic error is plotted on the x-axis. A systematic error of 2.0 means a systematic shift equivalent to two times the standard deviation of the method. The different curves correspond to the different control rules and N's shown in the key at the right side of the graph. The S-shaped nature of these power curves shows you that shifts less that 2 times the standard deviation of the method will be difficult to detect. Shifts of 3s should be detectable if the right QC procedure is selected. Shifts of 4s or greater would be detectable by any of these QC procedures.
5. Assess the probabilities for rejection.
| Two probabilities are of interest - the probability of error detection (Ped) for the critical systematic shift and the probability of false rejection (Pfr). The probability of error detection can be found by imposing the critical systematic error of 3.68 on the power function graph to give the accompanying critical-error graph. You can then read the Ped values for the different QC procedures from the points of intersection with the power curves, and they are also shown in the Ped column in the key at the right side. The Pfr values are read from the y-intercepts of the power curves, which are also shown under the Pfr column in the key. |
|
6. Select the control rules and number of control measurements.
Using the information from the critical-error graph, look for a QC procedure that gives a Ped of 0.90 or greater and a Pfr of 0.05 or less. You have four choices in this potassium example. The 12s rule will have 9% false rejections and 99% error detection; the 12.5s rule will give 3% false rejections and 97% error detection; the multirule procedure will give 1% false rejections and 95% error detection; the 13s rule will give essentially 0% false rejections and 91% error detection. The best choices here are the multirule and 13s single rule procedures because they provide the necessary error detection with the lowest false rejection rates.
7. Adopt a Total QC strategy.
Your total QC system involves statistical QC, other QC components such as preventive maintenance, system function checks, measurement validation tests, and patient data QC, and finally quality improvement (QI). The appropriate balance of these components can be decided based on the error detection that is available from your statistical QC procedure, as shown in the accompanying table. If Ped is high, 0.90 or greater, you can depend on statistical QC to detect problems, therefore do the minimum other QC that is required by government regulations, accrediation standards, manufacturer's instructions, and good laboratory practice. If Ped is moderate, 0.50 or greater, balance your efforts between statistical QC and other QC; also attempt to improve the performance of the method (QI) by reducing any bias and minimizing the standard deviation of the method. If Ped is low, less than 0.50, you will need to depend primarily on other QC and should make a serious effort to improve method performance, possibly even replacing your method with a new and better method.
8. Reassess for changes in performance.
This QC planning process should be repeated whenever there are changes in the performance of the method. If performance improves, it may be possible to use a simpler QC procedure with lower N. If performance deteriorates, it may be necessary to increase the amount of QC, increasing N and changing the control rules to narrowor limits or increasing the rules to form multirule procedures.
For our potassium example, we need only 2 control measurements per run and can use a Levey-Jennings chart with control limits set as the mean plus and minus 3 standard deviations. The process by which we arrive at this answer is somewhat complicated, but the answer itself is simple and easy to implement in the laboratory. With practice in QC planning and with support via the proper QC planning tools, it will also be simple to arrive at the right answer.

