Six Sigma
Six Sigma - A Project in Action
Recently, the Charleston Area Medical Center in West Virginia embraced Six Sigma. Melda Brown, a Black Belt in training, is one of their staff bringing better quality control to healthcare. Ms. Brown has been extremely generous in allowing us a glimpse of her Six Sigma Project as it is being implemented. Here we present the Define and Measure phases of her project.
Chemistry Six Sigma
Contributed by Melda Brown, MLT, Black Belt
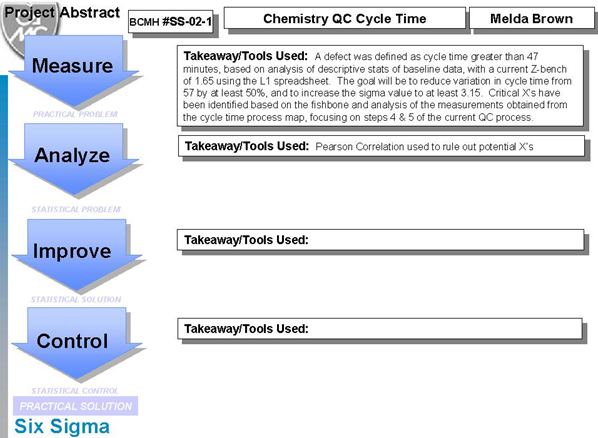
Below follows an in-depth analysis of an ongoing Six Sigma project on Chemistry Cycle time. Melda Brown, interviewed earlier on this website, has offered us a glimpse of the details of her current project, providing us with a set of slides as well as her original project charter. The Six Sigma project methodology is called DMAIC, which stands for Define-Measure-Analyze-Improve-Control. At the time of posting, she had completed the Define-Measure phases of the project. We hope to present the other phases of the project in the future.
What follows below is presentation of selections from her slides, with notes and commentary.
Define: The Project
Every Six Sigma project has a rigorous definition of the problem, scope, potential benefits, and alignment with corporate goals. The actual make-up of the project itself is also subject to very specific definition.
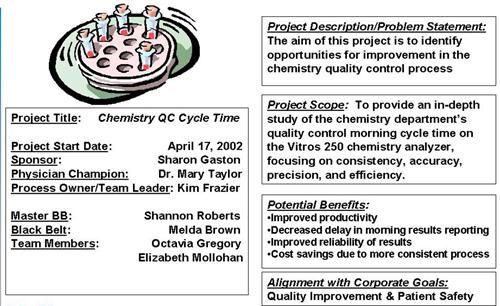
Notes: The Six Sigma project clearly defines the members of the project team. The Master Black Belt, Shannon Roberts, plays an advisory role to Melda Brown, who is in charge of the project. The additional roles of a sponsor, physician champion, and process owner/team leader in the project description help to identify key personnel who can help pave the way for the project. Whenever a roadblock threatens the project, the sponsor or champion, who typically have more power in the organization, can step in to clear it.
Six Sigma recognizes the resistance of management and the inertia of corporate bureaucracy that can prevent projects from succeeding. By making sure at the very beginning that the project's goal is in alignment with corporate goals, the project has a much better chance of success.
Define: The problem, The defect, The data, The specific goal
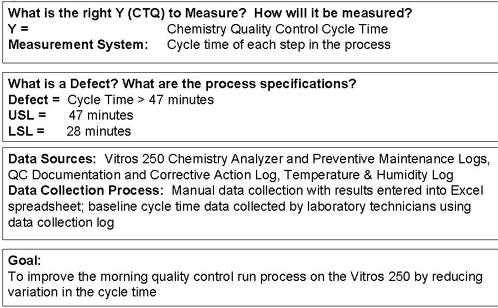
Notes: Here the project narrows its focus. The Chemistry testing process is narrowed down to the Cycle Time, which is considered the Critical-To-Quality (CTQ) measurement. Then a defect is defined, so that Sigma-metrics can be calculated later on. Next the data sources are identified. Knowing where the data is -- is critical. And finally, the goal is stated here.
Commentary: There is one hidden assumption at this point -- that the quality on the Chemistry process is adequate. You wouldn't focus on cycle time (and try to speed things up) unless you were happy with the existing quality of the test results. Even in a Six Sigma project, it's possible to fall into the trap of assuming quality is okay. But fortunately the project analysis will assess the actual quality being achieved by the testing processes.
Resources and Obstacles
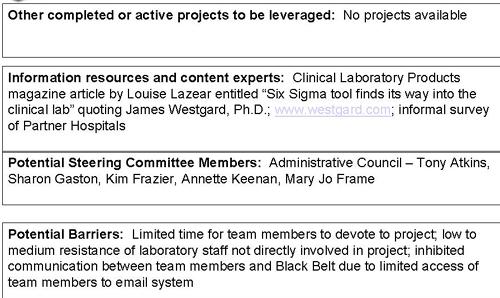
Notes: Here the project lists available resources as well as obstacles. Resources include previous Six Sigma projects, other types of expertise that can be accessed, as well as other members of the institution that can provide information, insight, advice, and other forms of help. If there were any previous Six Sigma projects completed by the organization in this area, they could be leveraged by this project. Since this is one of the first projects completed by the organization, however, there aren't any previous projects to reference. Other resources are listed, too, which in this case includes Westgard QC.
Finally, a realistic assessment is made of the barriers and obstacles arrayed against the project. "Resistance" is also assessed here. Where resistance is high, even a well-run Six Sigma project can fail, simply because the personnel don't want to help or implement improvements. Again, this is one of Six Sigma's strengths: realistically acknowledging the way politics work in an institution.
Ishikawa "Cause and Effect" Diagram - the Process "Fishbone"
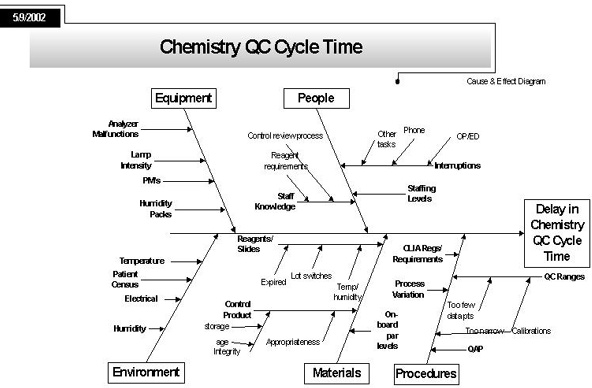
Notes: Here the project defines, in as much detail as possible, all the elements that contribute to the process problem under scrutiny. Basically, the team brainstorms to try and identify all the possible reasons why there is a delay in chemistry cycle time.
The form of the diagram is called a "fishbone"; it was introduced by a Japanese engineer Ishikawa in the 1960s and 70s.
What is the "Voice of the Customer"?
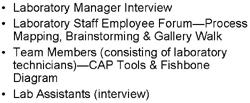
Notes: Here the project details how it listens to the "Voice of the Customer" -- meaning the people who are affected directly by the chemistry cycle time or who interact with it. Through these interviews, the problem gains better definition, the CTQs can be determined (see below), the process map can be developed, etc.
What parts of the process are Critical-To-Quality (CTQ)?
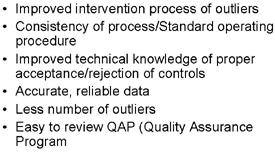
Notes: Most importantly, the project noted two key "takeaways": (1) Improving the process for verifying controls and (2) assuring that QC data is reliable.
Commentary: Notice how as we get closer to the process, we zoom in on the QC.
Describe the problem in more detail
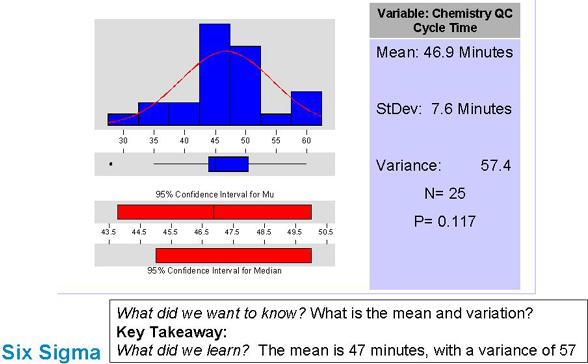
Notes: Here we see some real data on how much time the Chemistry cycle takes. It's easy to see that there is a lot of variation present (indicating the process isn't running smoothly).
Laboratory Chemistry QC Cycle Time
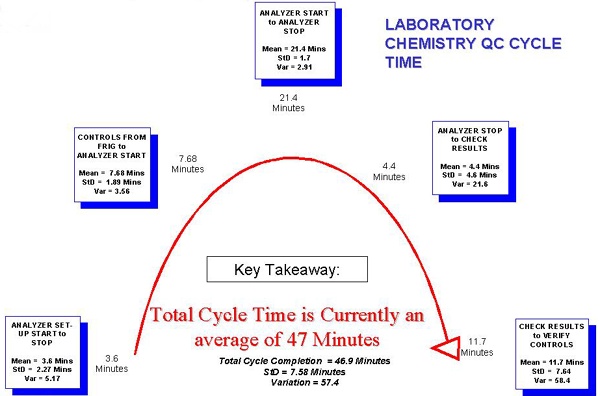
Notes: Here the steps of the Chemistry Cycle Time are broken down into significant categories. A significant amount of time (the second largest) is taken up by the step to Check Results to Verify Controls. Furthermore, this step can lead to a repeat cycle if tests are out of control.
Commentary: We are not surprised by this.
Where is the biggest variance in the cycle time?
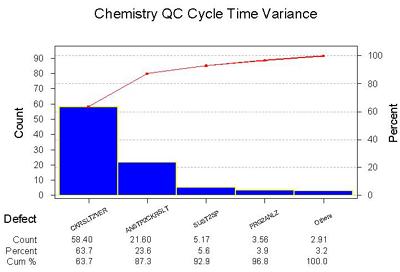
Notes: Here the categories of the process are analyzed by the amount of variance. The diagram here is a Pareto Diagram. The Pareto concept is that 80% of the problem can be found in 20% of the process. The blocks of time devoted to Stopping the Analyzer to Checking Results and Checking Results to Verify Controls have the highest variance.
One key observation: The step where control results are validated not only takes the a significant amount of time in the cycle process, it also has the most variance.
Commentary: Again, we are not surprised.
What's the Six Sigma value for Chemistry Cycle Time?
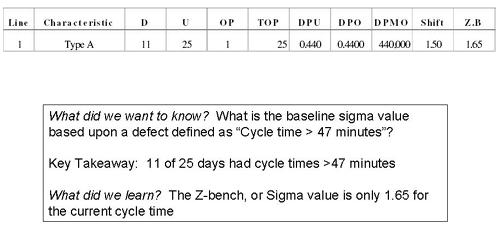
Notes: Here is a straighforward calculation of the Sigma-metric of the cycle process. On the basis of the definition of a defect as a cycle time more than 47 minutes, this process has a 1.65 Sigma-metric. Very low. Note that D = Defect, U = Units, OP = Opportunity per Unit, TOP = Total Opportunities, DPU = Defects per Unit, DPO = Defects per Opportunity (in percent), DPMO = Defects per Million Opportunities, Shift = the 1.5 small shift that needs to be tolerated without increasing the defect rate (see article here for an explanation), and Z.B = Z-bench or Sigma-value.
Commentary: A Sigma-metric of 1.65 is considered quite low. The definition of what a defect is may have been too severe. But later phases of the project will have to bear that out.
Where is the project going from here?
We hope to continue following this Six Sigma project as it continues. Stay tuned to the website. And once again, we thank Melda Brown, MLT and Black Belt at Braxton County Memorial Hospital.