QC Design
Cholesterol, Analytical Quality Requirement
An example planning QC for cholesterol using an analytical quality requiremen - from CLIA proficiency testing criteria for acceptability.
A simple example showing QC Planning with OPSpecs Charts
Note: at this time this was written, QC Validator was the QC Design software available. Validator has been replaced by EZ Rules 3, which has all the features and capabilities of the earlier version, as well as new enhancements.
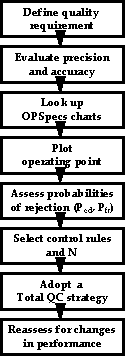
We're using a cholesterol example to illustrate the application of the QC planning process to select appropriate QC procedures for your laboratory tests. We recommend the 8-step process shown below. This QC planning process allows you to select control rules and numbers of control measurements (N) to monitor individual tests on the basis of the quality required by the test, the observed accuracy and precision of a method in your laboratory, and the expected error detection and false rejection characteristics of the QC procedure itself. At first, this planning process will seem formidable, but with practice it will become quick and easy to do.
- 1. Define the Quality Requirement
- 2. Evaluate the precision and accuracy of the method
- 3. Look Up OPSpecs Charts
- 4. Plot Operating Point
- 5. Assess probabilities of rejection
- 6. Select the control rules and numbers of control measurements
- 7. Adopt a Total QC Strategy
- 8. Reassess for changes in performance
- For further reading
 1. Define the quality requirement.
Each individual test has its own quality requirements in clinical or analytical terms. For practical purposes, the CLIA proficiency testing criteria for acceptability provide the minimum total error requirements for all regulated tests. For example, the total error that is allowable for a cholesterol test is 10%. This means a test result should be correct within 20 mg/dL at a concentration of 200 mg/dL.
Example data for this application:
-
- Test: Cholesterol
- Decision level: 200 mg/dL
- Imprecision SD: 4 mg/dL
- Inaccuracy (bias): 4 mg/dL
- Number of control materials: 2
2. Evaluate the precision and accuracy of the method.
Method performance can be assessed from initial method evaluation studies, on-going validation studies, and current performance on internal and external control materials. It is best that these performance characteristics reflect how the method works in your laboratory, however, estimates can also be obtained from evaluation studies in the literature and from manufacturer’s claims in product labeling. In this example, our cholesterol method has a 4 mg/dL SD and a 4 mg/dL bias.
The CV and bias must be expressed in percentages. Use the control level (the level at which you run controls, a target value where a small change becomes important, etc.) as a basis for calculation. For cholesterol, this level comes at 200 mg/dL. Now if your SD is 4 mg/dL, then the %CV is 4/200 = 2%. Likewise, if your bias is 4 mg/dL, then the %bias is 4/200 = 2%.
3. Look up OPSpecs charts.
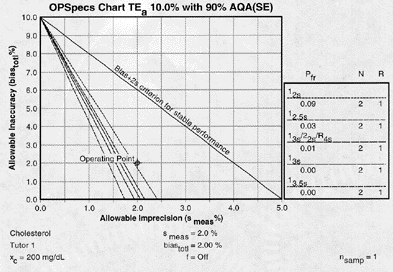
Since the analytical quality requirement is 10%, we should look at OPSpecs charts for a 10% quality requirement. Furthermore, if the instrument for our method runs two control materials, then we want to look at control rules with numbers of measurement (N's) of 2 or 4. Thus, we want to look at OPSpecs charts for a 10% analytical quality requirement and N's of 2 and 4. There are several ways to obtain these OPSpecs charts. For those with a computer, the QC Validator program will produce OPSpecs charts for any quality requirement and three different levels of error detection (90% AQA, 50% AQA, and 25% AQA). For this example, we are going consult an OPSpecs Manual, which is a library of OPSpecs for common control rules and quality requirements. An index of charts tells us that we can find the relevant OPSpecs charts on pages 3-60 and 3-61 of the OPSpecs Manual, Expanded Edition. A two page layout displays 4 OPSpecs charts in the following order:
| 90% AQA with N's of 2 (Look here 1st) |
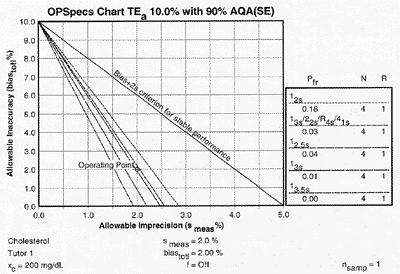
90% AQA with N's of 4 (Look here 2nd) |
| 50% AQA with N's of 2 (Look here 3rd) |
50% AQA with N's of 4 (Look here 4th) |
The objective is to achieve 90% error detection with the lowest N possible. Thus, you start by looking at OPSpecs chart with the highest error detection and lowest N.
|
If we move to the 90% AQA N=4 chart, we notice that there are two lines that are above the operating point. Those two lines represent control rules that guarantee at least the error detection listed in the title of the chart. For our example, the two control rules guarantee over 90% error detection. [A third line is very close to but not over the operating point on this chart. This is a borderline case. In your lab, it may be close enough to consider. In our example, we take a strict above-the-point policy.] |
|
5. Assess the probabilities for rejection.
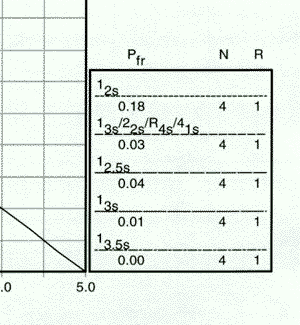
| Check the key at the right of the graph to match up the lines that passed above your operating point with the control rules and N's they represent. Note the column labelled Pfr lists the false rejection of each control rule. Ideally, you want to aim for a Pfr of 5% or less. Of the two control rules above the operating point, the 12s control rule with N=4 will have an 18% false rejection rate. If your method is stable and has no problems, you will still have an out-of-control signal about every fifth run. This is an unacceptable level of false alarms. The second QC procedure is a 13s/22s/R4s /41s multirule with N=4 has a 3% false rejection rate. |
|
6. Select the control rules and number of control measurements.
In our example, we have two choices:
- The single rule 12s with 18% false rejection, or
- the multirule 13s/22s/R4s /41s multirule with a 3% false rejection.
The multirule provides 90% error detection with less than 5% false rejection. These are the ideal conditions to seek.
In situations where 90% error detection cannot be achieved by increasing N and/or using multi-rule criteria, then you may consider optimizing performance for the observed or expected stability of the process (frequency of errors). Consider 50% error detection for moderately stable processes. Consider 25% error detection for highly stable processes that seldom have problems.
7. Adopt a Total QC strategy.
Your total QC system involves statistical QC, other QC components such as preventive maintenance, system function checks, measurement validation tests, and patient data QC, and finally quality improvement (QI). The appropriate balance of these components can be decided based on the error detection that is available from your statistical QC procedure. If Ped is high, 0.90 or greater, you can depend on statistical QC to detect problems, therefore do the minimum other QC that is required by government regulations, accrediation standards, manufacturer's instructions, and good laboratory practice. If Ped is moderate, 0.50 or greater, balance your efforts between statistical QC and other QC; also attempt to improve the performance of the method (QI) by reducing any bias and minimizing the standard deviation of the method. If Ped is low, less than 0.50, you will need to depend primarily on other QC and should make a serious effort to improve method performance, possibly even replacing your method with a new and better method.
In our example, we achieved high error detection and low false rejection, so we can minimize our QC costs and concentrate our energies on the more difficult tests in our laboratory.
8. Reassess for changes in performance.
This QC planning process should be repeated whenever there are changes in the performance of the method. If performance improves, it may be possible to use a simpler QC procedure with lower N. If performance deteriorates, it may be necessary to increase the amount of QC, increasing N and changing the control rules to narrow our limits, or increasing the rules to form multirule procedures.
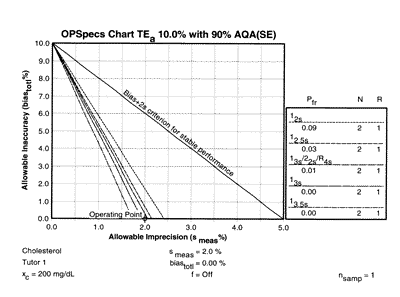 Changes in imprecision and inaccuracy can be examined using a chart of operating specifications (OPSpecs chart), such as shown for N=2. The performance of the original method was shown by an operating point of 2.0% CV (x-coordinate) and 2.0% bias (y-coordinate). The effect of reducing bias to to 0.0% can be assessed by plotting a new operating point of 2.0% CV and 0.0% bias, as shown at the right. With this improvement in accuracy, it would be possible to control the test with a 12.5s single rule or a 13s/22s/R4s multirule with N=2. A reduction of bias from 2.0% to 0.0% would allow us to reduce N from 4 to 2. Thus, even though we are able to implement an effective QC procedure here, we could still save money by improving the performance of our method.
For Further Reading
- Westgard JO. "Assuring analytical quality through process planning and quality control." Arch Pathol Lab Med 1992;116:765-769.
- Westgard JO, Wiebe DA. "Cholesterol operational process specifications for assuring the quality required by CLIA proficiency testing." Clin Chem 1991;37:1938-1944.
- Westgard JO. "Charts of operational process specifications (‘OPSpecs charts’) for assessing the precision, accuracy, and quality control needed to satisfy proficiency testing performance criteria." Clin Chem 1992;38:1226-1233.

