Sigma Metric Analysis
Unicel DxC 800
We highlight a poster from the 2005 AACC/ASCLS/IFCC conference, "Evaluation of the Beckman Coulter UniCel DxC 800 Synchron Clinical System", (H. Stiegler, A. Breuer, A. Pozun, M. Krieg). The data provided in this evaluation can be converted into Sigma metrics.
From Method Validation to Six Sigma Metrics: Evaluating a Unicel DxC 800 Synchron
- Recap: What do you need to go from Method Validation to Six Sigma?
- What calculations do you perform and in what order?
- Estimate Bias at the critical level of performance
- What's a Quality Requirement and where do I find it?
- Calculating Sigma Metrics from Bias, CV and Quality Requirement
- Conclusion
- Postscript: How would you QC this instrument?
October 2005
 |
[Note: This QC application is an extension of the lesson From Method Validation to Six Sigma: Translating Method Performance Claims into Sigma Metrics. This article assumes that you have read that lesson first, and that you are also familiar with the concepts of QC Design, Method Validation, and Six Sigma. If you aren't, follow the link provided.] |  |
This month we highlight another poster from the 2005 AACC/ASCLS/IFCC conference, "Evaluation of the Beckman Coulter UniCel DxC 800 Synchron Clinical System", (H. Stiegler, A. Breuer, A. Pozun, M. Krieg). The data provided in this evaluation can be converted into Sigma metrics.
Recap: What do you need to go from method validation to Six Sigma?
From the Method Validation study, preferably performed in your laboratory. Otherwise, use the data provided by the manufacturer:
From other sources:
- Quality Requirement (CLIA, clinical, biologic or otherwise)
- Calculators (Six Sigma)
- Medical Decision Levels
- A QC Design tool (optional, but useful)
What data is available?
In this case, the paper provides nearly everything we need to know:
Analyte Units CV P-B Regression Equation n r Glucose mg/dL 1.9% y = 0.963x + 5.537 200 0.997 Creatinine mg/dL 2.5% y = 1.000x + 0.000 200 0.997 BUN mg/dL 2.7% y = 1.000x + 0.000 200 0.999 K+ mmol/L 2.0% y = 1.000x - 0.200 200 0.992 Sodium mmol/L 2.8% y = 1.000x + 0.000 200 0.956 Ca2+ mg/dL 2.0% y = 1.000x + 0.020 200 0.996 Chloride mmol/L 2.7% y = 1.000x + 0.000 200 0.981 LD U/L 3.2% y = 0.997x + 1.742 200 0.999 CK U/L 3.0% y = 1.011 + 1.335 200 1.0 We include the correlation coefficients - but remember, those numbers alone are not sufficient grounds to judge that the method is acceptable. All the r tells you is that even simple linear regression would be adequate here for all tests. When the r is below 0.97 or 0.95, methods like Deming or Passing-Bablock regression are recommended. In this case, Passing-Bablock regression was already used, and the study included 200 values, so we can confidently accept all the regression equations.
Note that no levels were given for this study. We don't know the level where these controls were run. That's not great, but having some numbers is better than having none at all.
The paper notes that the imprecision estimates we list above are from a between-day study where the n=11 "by use of two levels of independent commercial control material (BioRad) as well as one serum pool." A within-run imprecision study was also run (n=21) but between-day estimates are preffered over within-run estimates.
More details about the use and interpretation of statistics are available on this website.
What calculations do I have to perform, and in what order?
- Use the regression equation to estimate bias at a medical decision level (Xc) where performance is important.
- Find the quality requirement for that important decision level.
- Calculate Sigma metrics.
To identify critical levels of interest, we consult the Medical Decision Levels provided by Dr. Statland's book. (This reference provides a number of different decision levels - our choices may not be the ones that you would prefer, so feel free to recalculate with your preferred critical levels.) In this case, we make an assumption that the CV figures in the paper are representative of the CV at the selected critical levels. Ideally, we would have imprecision studies run at those levels, but this time we don't.
Analyte Units Critical level CV P-B Regression Equation Glucose mg/dL 120.0 mg/dL 1.9% y = 0.963x + 5.537 Creatinine mg/dL 1.6 mg/dL 2.5% y = 1.000x + 0.000 BUN mg/dL 26.0 mg/dL 2.7% y = 1.000x + 0.000 K+ mmol/L 3.0 mmol/L 2.0% y = 1.000x - 0.200 Sodium mmol/L 115.0 mmol/L 2.8% y = 1.000x + 0.000 Ca2+ mg/dL 11.0 mg/dL 2.0% y = 1.000x + 0.020 Chloride mmol/L 90.0 mmol/L 2.7% y = 1.000x + 0.000 LD U/L 500.0 U/L 3.2% y = 0.997x + 1.742 CK U/L 240 U/L 3.0% y = 1.011 + 1.335 Estimate Bias at the critical level of performance.
How do you do this? By using the Regression Equation:
Yc = a + b Xc where Yc and Xc represent the test and comparison values, respectively at a critical medical decision level, b is the slope, and a is the y-intercept. The slope and y-intercept are given from the comparison of methods experiment.
You use the critical medical decision level as your Xc value. Then solve the Regression Equation for Yc. This will estimate what the value of the test method will be at that level.
Next, take the value of Yc-Xc, and divide it by Xc. This provides an estimate of bias as a percentage.
At the end of these calculations, you have estimates of bias and CV at the same level.
Here’s what our example data looks like after we’ve performed these calculations:
y = .963(120) + 5.537
y = 121.1
= [(120 - 121.1 ) / 120 ] * 100 = 0.92% bias
(note we use bias as an absolute number here)
Analyte Units Critical level CV %Bias P-B Regression Equation Glucose mg/dL 120.0 mg/dL 1.9% 0.92% y = 0.963x + 5.537 Creatinine mg/dL 1.6 mg/dL 2.5% 0% y = 1.000x + 0.000 BUN mg/dL 26.0 mg/dL 2.7% 0% y = 1.000x + 0.000 K+ mmol/L 3.0 mmol/L 2.0% 6.66% y = 1.000x - 0.200 Sodium mmol/L 115.0 mmol/L 2.8% 0% y = 1.000x + 0.000 Ca2+ mg/dL 11.0 mg/dL 2.0% 0.18% y = 1.000x + 0.020 Chloride mmol/L 90.0 mmol/L 2.7% 0% y = 1.000x + 0.000 LD U/L 500.0 U/L 3.2% 0.05% y = 0.997x + 1.742 CK U/L 240 U/L 3.0% 1.65% y = 1.011 + 1.335 Note that even after those calculations, it’s still difficult to judge the quality of this method. We know CV and bias, but how does that relate to the necessary quality for the method? Here's where quality requirements enter the picture.
What’s a quality requirement and where do I find it?
Finding or defining quality requirements is a critical step in the QC Design Process. We refer you to those articles on the website for more explanation. Since we are working with a chemistry instrument, we are in luck. CLIA has defined the quality requirements for all the analytes covered in this paper. Let’s add that to our table:
Analyte Units Critical level Quality Req. CV %Bias notes Glucose mg/dL 120.0 mg/dL 10.0% 1.9% 0.92% Creatinine mg/dL 1.6 mg/dL 18.75% 2.5% 0% +/- 0.3 mg/dL @ 1.6 mg/dL BUN mg/dL 26.0 mg/dL 9.0% 2.7% 0% K+ mmol/L 3.0 mmol/L 16.66% 2.0% 6.66% +/- 0.5 mmol/L @ 3.0 mmol/L Sodium mmol/L 115.0 mmol/L 3.48% 2.8% 0% +/- 4.0 mmol/L @ 115.0 mmol/L Ca2+ mg/dL 11.0 mg/dL 9.09% 2.0% 0.18% +/- 1.0 mg/dL @ 11.0 mg/dL Chloride mmol/L 90.0 mmol/L 5.0% 2.7% 0% LD U/L 500.0 U/L 20.0% 3.2% 0.05% CK U/L 240 U/L 30.0% 3.0% 1.65% In some cases, where noted, the CLIA quality requirement is given in concentration units, which must then be converted into percentages for the critical medical decision level. For example, the Calcium critical level is 11.0 mg/dL, and the CLIA requirement is for the result to be within 1.0 mg/dL of that level. A simple calculation gives us the total allowable error percentage: (1.0/11/0)*100 = 9.09
Now that we’ve added the quality requirement, we’re ready to get Sigma metrics!
Calculating Sigma Metrics from Bias, CV and Quality Requirement.
Again, the website has already covered the relationship between Sigma Metrics and bias, CV, and quality requirements. There is even a free online calculator on Westgard Web to perform the caculations.
Let’s use the Sigma Metric equation:
(Quality Requirement - Bias ) / CV = Sigma metric
[either all terms in units or all terms in percentages as the case is here]
In our glucose example:
(10 - .92) / 1.9 = 5.26
Analyte Quality Req. CV %Bias Sigma metric Sigma metric without bias Glucose 10.0% 1.9% 0.92% 4.78 5.26 Creatinine 18.75% 2.5% 0% 7.50 7.50 BUN 9.0% 2.7% 0% 3.33 3.33 K+ 16.66% 2.0% 6.66% 5.0 8.33 Sodium 3.48% 2.8% 0% 1.24 1.24 Ca2+ 9.09% 2.0% 0.18% 4.45 4.54 Chloride 5.0% 2.7% 0% 1.85 1.85 LD 20.0% 3.2% 0.3% 6.23 6.25 CK 30.0% 3.0% 1.65% 9.45 10.0 Here we see that the goal of Six Sigma has been achieved (and exceeded) by three analytes, and that the metrics for the other analytes are pretty good. The calcium, sodium, and chloride metrics are the lowest, but for most methods, these are usually troublesome tests. Note also that if the biases were reduced to zero, then the Sigma metrics would look much better.
Conclusion?
For two of these methods in the new instrument, defect-free operation is possible. We advise you to celebrate that fact. However, these metrics still require some context. For instance, what does this performance mean in terms of the QC required? And how does the performance stack up against other chemistry instruments?
Postscript: How would you QC this instrument?
For a moment, let’s assume that you have this instrument. Even for the methods where Six Sigma performance is possible, there is no promise that you're never going to see an out-of-control result. Errors will still occur, not only due to random factors, including human error (using the wrong control), but also during control lot switches, calibration times, etc. There are still problems that will occur when the instrument becomes "unstable." But under stable performance, there should be very few defects.
But even during stable performance, you may get out-of-control flags due to "noise" or false rejection. Your choice of control rule at this point will determine how many false rejections (false alarms) you can expect to encounter. When a method has a Sigma metric of 6 or higher, the out-of-control flags you see will often be due to false rejection, not real errors. The goal with six Sigma metric methods is to use control rules that reduce the false rejection to as few as possible.
For the methods with Sigmas below 6, you need to do a QC Design phase, and correctly select the appropriate control rule (or rules) to match the performance of the method.
There are free QC Design tools available on the website - Normalized OPSpecs charts - and there is also the QC Design software EZ Rules® 3.
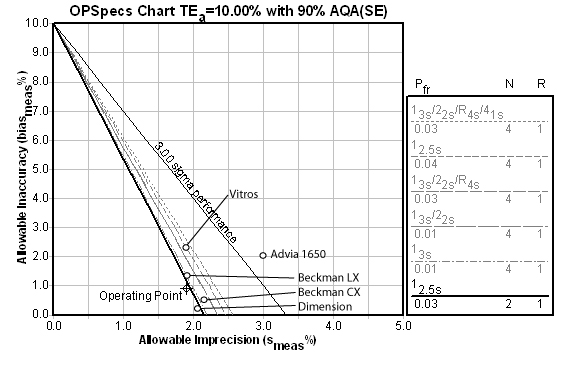
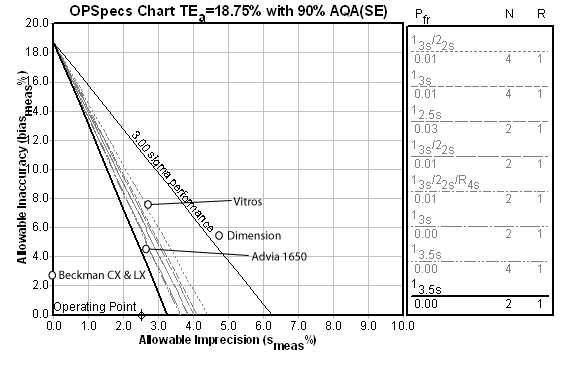
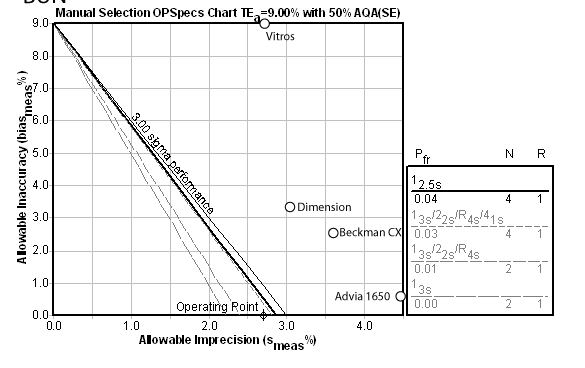
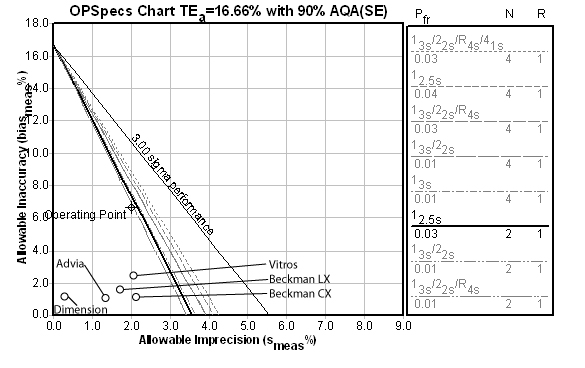
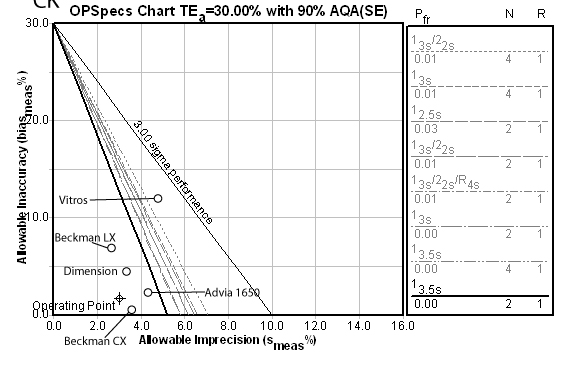
What follows below are OPSpecs charts generated by the EZ Rules® 3 program, except that we have included data from similar chemistry instruments. This comparison data is available from the Wadsworth New York Proficiency Testing program (May 2005 Testing Event, available to public access):
Glucose:
For this method, the Automatic QC Selection function of EZ Rules® 3 has selected a 13.5s with 2 control measurements per run. The instrument performance here is the "best in class."
Creatinine:
For this method, the Automatic QC Selection function of EZ Rules® 3 has again selected a 13.5s with 2 control measurements per run. The instrument performance here is excellent, although the CX and LX instruments are also impeccable.
BUN:
For this method, the Automatic QC Selection function of EZ Rules® 3 selected a Maximum QC procedure of a number of "Westgard Rules" as well as 4 control measurements per run. However, in this case, we manually selected a 12.5s rule with N of 4, which might be simpler to implement than the multirules. Note also that the method performance is still better than its competitors.
Potassium
For this method, the Automatic QC Selection function of EZ Rules® 3 has selected the 12.5s rule with 2 control measurements per run. Note that most of the methods have excellent performance (low CV and low bias).
Sodium:
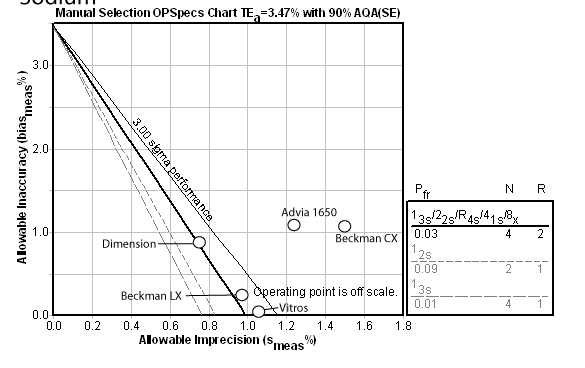
Sodium is one of those problem methods. Here you can see the actual performance is off the scale, and the program has recommended a Max QC procedure (i.e. as many multirules and controls as you can afford to run). The other methods suffer the same problem and would also have to use the Max QC procedure. No method has the needed performance characteristics.
Calcium
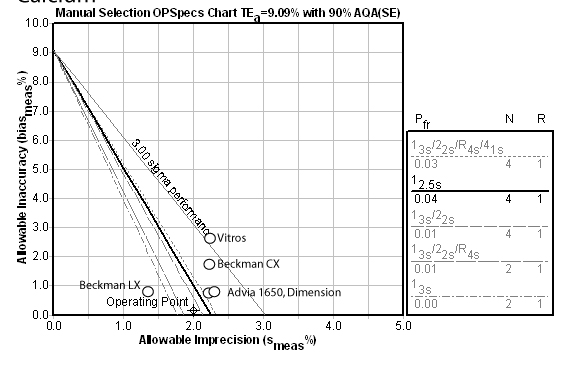
For this method, the Automatic QC Selection function of EZ Rules® has recommended a 12.5s rule with 4 control measurements. The method performs better than most of its competitors, and the only method that might be able to run 2 controls is the Beckman LX.
Chloride:
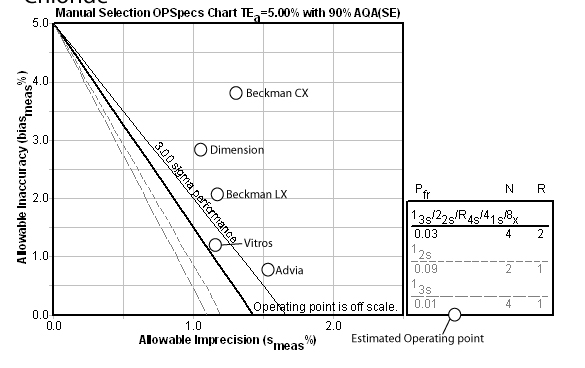
Chloride is yet another of those problem methods. All methods have inadequate performance. A Max QC procedure is recommended here.
LD:
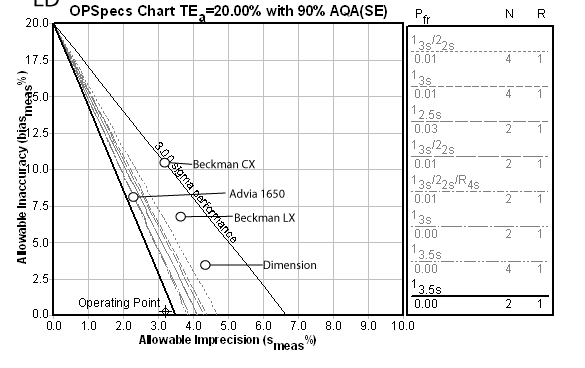
Here the method performs best in class, and even with very wide limits and only 2 control measurements per run, the necessary quality will be achieved.
CK:
This method performs superior to most of its competitors. Having achieved better than Six Sigma performance, only 2 control measurements per run are needed, with very wide limits.
Here's a final summary of metrics and recommendations:
Analyte Quality Req. Sigma metric Sigma metric
without biasControl Rule Recommendations Glucose 10.0% 4.78 5.26 12.5s with N=2 Creatinine 18.75% 7.50 7.50 13.5s with N=2 BUN 9.0% 3.33 3.33 12.5s with N=4 K+ 16.66% 5.0 8.33 12.5s with N=2 Sodium 3.48% 1.24 1.24 13s/22s/R4s/41s/8x N=4 R=2 Ca2+ 9.09% 4.45 4.54 12.5s with N=4 Chloride 5.0% 1.85 1.85 13s/22s/R4s/41s/8x N=4 R=2 LD 20.0% 6.23 6.25 13.5s with N=2 CK 30.0% 9.45 10.0 13.5s with N=2

