Quality Standards
The Quality of ...The Quality of... Series
To study the usefulness of the calculations from The Quality of Laboratory Testing series, we took a look at one proficiency testing program, the New York State Wadsworth program. Rather than look at a single event, we looked at all the events for two years.
Looking at the Proficiency Testing Data
April 2006
 |
[Note: This QC application is an extension of the lesson From Method Validation to Six Sigma: Translating Method Performance Claims into Sigma Metrics. This article assumes that you have read that lesson first, and that you are also familiar with the concepts of QC Design, Method Validation, and Six Sigma. If you aren't, follow the links provided.] |  |
We have previously presented data and calculations about the Quality of Laboratory testing for several touchstone tests. The conclusions of the studies are in marked contrast with the conventional wisdom. Where the laboratory professionals usually assume that test performance is more than adequate than needed for medical usefulness, the data tell the opposite story: many test methods are performing poorly, and some are performing far worse than needed for proper medical use.
The methodology of the studies have been previously presented here. To summarize it briefly, we selected data from individual proficiency testing events from all the proficiency testing programs with the publicly available data.
To study the usefulness of these calculations, we took a look at one proficiency testing program, the New York State Wadsworth program. Rather than look at a single event, we looked at all the events for two years.
Broad measures of Quality from PT data
In addition to the three summary metrics (NTQ, LMQ, and NMQ), we have calculated the Weighted Average CV, eighted Average Bias, and the Sigma calculated by those weighted average figures.
|
Month
|
National Test Quality
(NTQ) |
Local Method Quality
(LMQ) |
National Method Quality
(NMQ) |
Weighted
Average CV |
Weighted
Average Bias |
Weighted
Average Sigma |
| Application |
4.09
|
4.83
|
4.48
|
-
|
-
|
-
|
| Jan 2004 |
4.095
|
5.041
|
4.677
|
2.135
|
0.721
|
4.326
|
| May 2004 |
2.161
|
4.856
|
3.461
|
2.226
|
2.885
|
3.197
|
| Sept. 2004 |
2.273
|
4.856
|
3.536
|
2.257
|
2.899
|
3.147
|
| Jan 2005 |
2.543
|
4.827
|
3.898
|
2.382
|
2.285
|
3.238
|
| May 2005 |
4.150
|
4.524
|
3.797
|
2.448
|
1.528
|
3.461
|
| Sept 2005 |
3.787
|
4.858
|
4.306
|
2.182
|
1.140
|
4.060
|
| Average |
3.168
|
4.827
|
3.946
|
2.272
|
1.910
|
3.575
|
| stan. dev. |
0.939
|
0.167
|
0.467
|
0.120
|
0.919
|
0.506
|
Of these measures, it's clear that the most volatile metrics are the National Test Quality and the Weighted Average Bias. The bias changes most from event to event. The NTQ takes the bias into account in an unweighted form. The most stable measures are the Weighted Average CV, and the Local Method Quality (which is based solely on the imprecision measurement).
What do these metrics mean in practice? Using our previous "rules of thumb" on Sigma metrics, we can determine roughly what control rules and N would be required for each event.
|
Month
|
National Test Quality
(NTQ) |
Rough Rules
|
Local Method Quality
(LMQ) |
Rough Rules
|
National Method Quality
(NMQ) |
Rough Rules |
| Application |
4.09
|
N=4, Multirule or 2.5s |
4.83
|
N=4, Multirule or 2.5s
|
4.48
|
N=4, Multirule or 2.5s |
| Jan 2004 |
4.095
|
N=4, Multirule or 2.5s |
5.041
|
N=2, 2.5s or 3s limits
|
4.677
|
N=4, Multirule or 2.5s |
| May 2004 |
2.161
|
Max QC |
4.856
|
N=4, Multirule or 2.5s
|
3.461
|
Max QC |
| Sept. 2004 |
2.273
|
Max QC |
4.856
|
N=4, Multirule or 2.5s
|
3.536
|
Max QC |
| Jan 2005 |
2.543
|
Max QC |
4.827
|
N=4, Multirule or 2.5s
|
3.898
|
Max QC |
| May 2005 |
4.150
|
N=4, Multirule or 2.5s |
4.524
|
N=4, Multirule or 2.5s
|
3.797
|
Max QC |
| Sept 2005 |
3.787
|
Max QC |
4.858
|
N=4, Multirule or 2.5s
|
4.306
|
N=4, Multirule or 2.5s |
| Average |
3.168
|
Max QC |
4.827
|
N=4, Multirule or 2.5s
|
3.946
|
Max QC |
| stan. dev. |
0.939
|
0.167
|
0.467
|
As you can see, with the metrics that include bias, they are switching between N=4 QC procedures to Maximum QC procedures (basically, using as many controls and rules as possible). With NMQ, there is only one switch, when the sigma reaches above 5.0, which allows the user to reduce QC to wide rules with N=2.
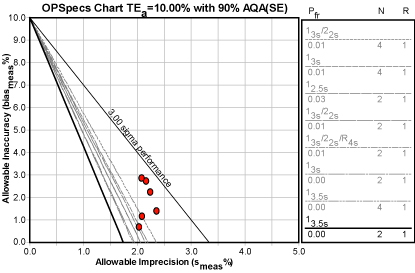
Next, with the weighted CV and bias figures, we can actually calculate the specific rule recommendations with EZ Rules:
|
Month
|
Weighted
Average CV |
Weighted
Average Bias |
Weighted
Average Sigma |
QC Recommendation by EZ Rules |
| Jan 2004 |
2.135
|
0.721
|
4.326
|
12.5s with N=4 |
| May 2004 |
2.226
|
2.885
|
3.197
|
12.5s with N=4 |
| Sept. 2004 |
2.257
|
2.899
|
3.147
|
13s22s/R4s/41s/8x with N=4 (Max QC) |
| Jan 2005 |
2.382
|
2.285
|
3.238
|
13s22s/R4s/41s with N=4 |
| May 2005 |
2.448
|
1.528
|
3.461
|
13s22s/R4s/41s with N=4 |
| Sept 2005 |
2.182
|
1.140
|
4.060
|
12.5s with N=4 |
| Average |
2.272
|
1.910
|
3.575
|
13s22s/R4s/41s with N=4 |
You can see the six events represented visually here:
But what if all these laboratories were using the CLIA minimum of 2 controls with limits set at the traditional 2s? What error detection would they by acheiving?
|
Month
|
Weighted
Average CV |
Weighted
Average Bias |
Weighted
Average Sigma |
QC Recommendation by EZ Rules |
Error Detection by 2s N=2 rules |
| Jan 2004 |
2.135
|
0.721
|
4.326
|
12.5s with N=4 |
0.94
|
| May 2004 |
2.226
|
2.885
|
3.197
|
12.5s with N=4 |
0.54
|
| Sept. 2004 |
2.257
|
2.899
|
3.147
|
13s22s/R4s/41s/8x with N=4 (Max QC) |
0.51
|
| Jan 2005 |
2.382
|
2.285
|
3.238
|
13s22s/R4s/41s with N=4 |
0.56
|
| May 2005 |
2.448
|
1.528
|
3.461
|
13s22s/R4s/41s with N=4 |
0.70
|
| Sept 2005 |
2.182
|
1.140
|
4.060
|
12.5s with N=4 |
0.89
|
Notice the big difference in error detection capability. Instead of catching errors in the first run where they occur, it might take 2 runs. And remember that when using 2s limits and 2 controls, you can expect up to 10% false rejections. So you should have at least 3 rejections in a month (if you have one run each day). If you're not, that means your limits or your sd are set wider, larger than they should be - and the error detection figures here are even lower.
Data on specific instrument groups
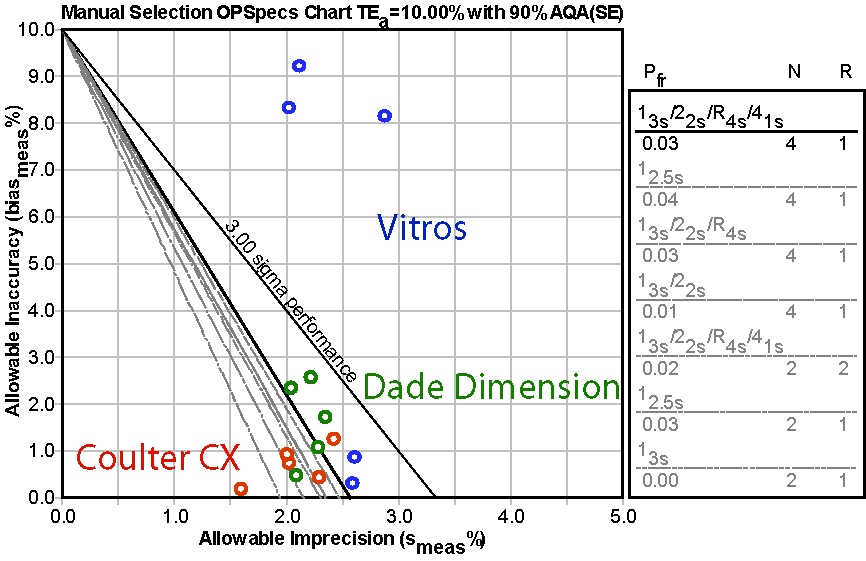
Looking at specific instruments, even more interesting details become clearer.
| Instrument Group | # of instruments | AvgCV | AvgBias | Sigma | Sigma w/Bias |
| Abbott Aeroset | 9-11 | 1.43 | 1.12 | 7.16 | 6.39 |
| Roche Integra | 10-12 | 2.59 | 1.71 | 3.98 | 3.35 |
| Hitachi Modular | 21-31 | 1.89 | 0.69 | 5.32 | 3.35 |
| Beckman Coulter LX | 31-39 | 2.12 | 0.93 | 4.82 | 4.38 |
| Olympus AU400/AU600/others | 30-39 | 2.1 | 2.98 | 4.86 | 3.47 |
| Beckman Coulter CX | 47-35 | 2.1 | 0.73 | 4.86 | 4.52 |
| J&J Vitros | 67-47 | 2.44 | 5.37 | 4.15 | 1.83 |
| Dade Dimension | 62-71 | 2.37 | 1.75 | 4.26 | 3.51 |
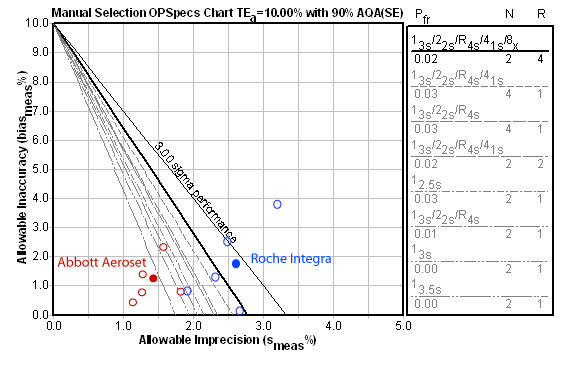
Because of the differing numbers of instruments in the survey, it's useful only to compare like with like. For instance, comparing the Abbott Aeroset with the Dade Dimension based on this data probably isn't as reliable as comparing the Abbot Aeroset with the Roche Integra. Below, you can see the results of each PT event at the critical level of interest, as well as the resulting average as a solid "operating point":
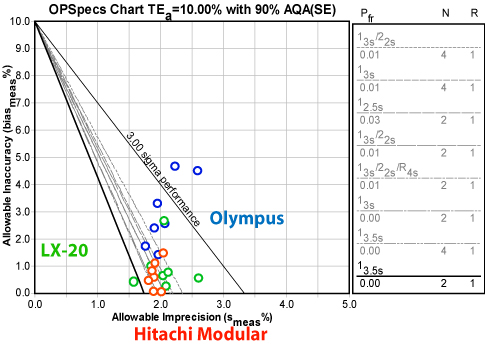
Here's a visual display of the three instruments in the middle of the pack:
Finally, here is a comparison of the last three instruments.
What have we learned?
The data in the proficiency testing surveys is fairly stable. Taking a fine grained approach, the data is even more stable in differentiating between the performance of instruments.
