Sigma Metric Analysis
Roche Modular
We analyze some data from the field and look at performance in the Roche Modular instrument.
- The CVs and Sigma metrics
- Estimates of Tolerable bias
- A combination of data for surrogate bias estimates
- Conclusions
September 2006
 |
[Note: This QC application is an extension of the lesson From Method Validation to Six Sigma: Translating Method Performance Claims into Sigma Metrics. This article assumes that you have read that lesson first, and that you are also familiar with the concepts of QC Design, Method Validation, and Six Sigma. If you aren't, follow the links provided.] |  |
Recently, a user submitted us with data from one of the hospitals where she consults. This laboratory has been working with the Roche Modular and decided to benchmark the performance of their methods on the Sigma scale.
The CVs and Sigma metrics
The TEa column lists the Total Allowable Error, as specified by the CLIA proficiency testing criteria. For Reticulocyte, which has no CLIA mandated quality requirement, data from the biological variation database was used to calculate an Biologic Total Error (TEba).
| Test | Observed Imprecision |
TEa | Sigma metric |
| Bicarbonate |
4.92%
|
12.00%
|
3.0
|
| Direct Bilirubin |
5.17%
|
20.00%
|
3.9
|
| Cholesterol |
2.00%
|
10.00%
|
5.0
|
| Glucose |
1.78%
|
10.00%
|
5.6
|
| Total Bilirubin |
3.05%
|
20.00%
|
6.6
|
| Total Protein |
1.64%
|
10.00%
|
6.1
|
| BUN |
1.56%
|
10.00%
|
6.4
|
| Phosphorus |
2.24%
|
15.00%
|
6.7
|
| Lipase |
3.58%
|
25.00%
|
7.0
|
| Creatinine |
1.98%
|
15.00%
|
7.6
|
| LDH |
2.57%
|
20.00%
|
7.8
|
| SGOT |
2.41%
|
20.00%
|
8.3
|
| Albumin |
1.09%
|
10.00%
|
9.2
|
| HDL-Cholesterol |
3.13%
|
30.00%
|
9.6
|
| Calcium |
1.70%
|
16.67%
|
9.8
|
| SGPT |
1.93%
|
20.00%
|
10.4
|
| Uric Acid |
1.33%
|
17.00%
|
12.8
|
| Amylase |
2.25%
|
30.00%
|
13.3
|
| Alkaline Phosphatase |
1.79%
|
30.00%
|
16.8
|
| Triglycerides |
1.42%
|
25.00%
|
17.6
|
| CPK |
1.36%
|
30.00%
|
22.1
|
Obviously, the numbers here are not only good, they're great. Of course, we have to keep in mind that these Sigma metrics are calculated without any bias data. Therefore, they are artificially high. Nevertheless, only 2 of the 21 methods are unacceptable at this point.
Estimates of Tolerable Bias
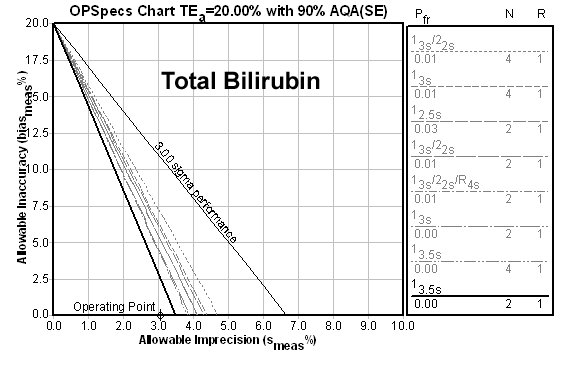
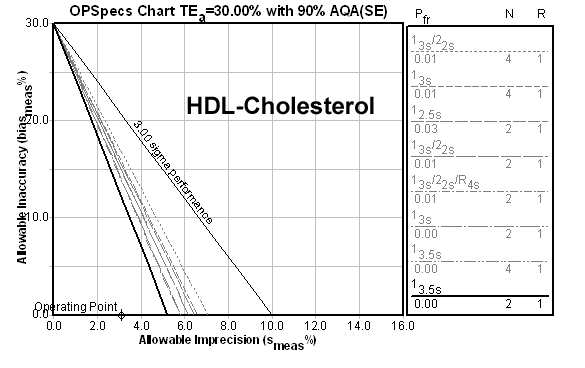
Now that we have the optimistic numbers, let's try to get more realistic. As noted before, we do not have bias figures for this instrument. However, we can make estimates of the bias that could be tolerated if defined Sigma metrics are assumed. From a QC Design perspective, there is not difference between a Sigma metric of 6.0 and a higher Sigma metric of 22.0. We can illustrate this by showing some of these metrics by OPSpecs charts [Note: the source of these graphs and recommendations is the EZ Rules(r) 3 QC Design program]:
Here's a 6.6 Sigma method:
Now here's a 9.6 Sigma method:
And now here's a 22.1 Sigma method:
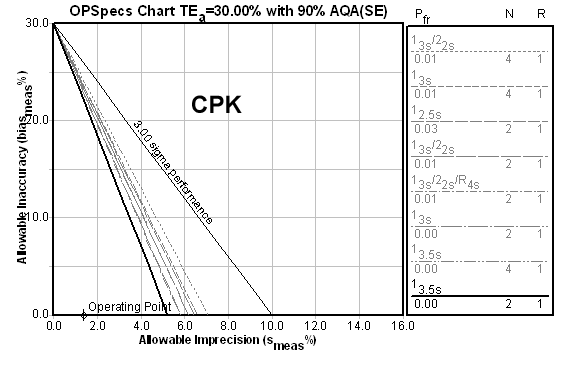
And what is the result of all these metrics? a recommendation for limits set at 3.5s with two controls per run, rejecting the run anytime a value is outside those limits. Beyond 6.0 Sigma, there is no practical difference in the control rule recommendation.
However, there is a practical effect of these metrics if they are only taking CV into account. A method with a Sigma metric of 22.1 based on CV alone will have a higher tolerable bias than a method with a Sigma metric of 6.0. For example, The CPK method above could tolerate up to 23.2% bias. Clearly, the higher Sigma metrics give you more safety margin while still achieving world class quality.
How do we calculate this tolerable bias? We manipulate the Sigma metric equation, plugging in 6.0 for the metric, and solve for bias:
Sigma = (TEa – bias)/CV.
6.0* CV = TEa -bias
bias + (6.0 *CV) = TEa
bias = TEa - (6.0*CV)
If we perform these calculations on all the methods, here are the results, not only for 6 Sigma but 5 Sigma as well:
| Test | Observed Imprecision |
TEa | Sigma metric | Tolerable Bias | |
| 5 Sigma | 6 Sigma | ||||
| Bicarbonate |
4.92%
|
12.00%
|
3.0
|
-
|
-
|
| Direct Bilirubin |
5.17%
|
20.00%
|
3.9
|
-
|
-
|
| Cholesterol |
2.00%
|
10.00%
|
5.0
|
0
|
-
|
| Glucose |
1.78%
|
10.00%
|
5.6
|
1.1
|
-
|
| Total Bilirubin |
3.05%
|
20.00%
|
6.6
|
4.75
|
1.7
|
| Total Protein |
1.64%
|
10.00%
|
6.1
|
1.8
|
0.16
|
| BUN |
1.56%
|
10.00%
|
6.4
|
2.2
|
0.64
|
| Phosphorus |
2.24%
|
15.00%
|
6.7
|
3.8
|
1.56
|
| Lipase |
3.58%
|
25.00%
|
7.0
|
7.1
|
3.52
|
| Creatinine |
1.98%
|
15.00%
|
7.6
|
5.1
|
3.12
|
| LDH |
2.57%
|
20.00%
|
7.8
|
7.15
|
4.58
|
| SGOT |
2.41%
|
20.00%
|
8.3
|
7.95
|
5.54
|
| Albumin |
1.09%
|
10.00%
|
9.2
|
4.55
|
3.46
|
| HDL-Cholesterol |
3.13%
|
30.00%
|
9.6
|
14.35
|
11.22
|
| Calcium |
1.70%
|
16.67%
|
9.8
|
8.17
|
6.47
|
| SGPT |
1.93%
|
20.00%
|
10.4
|
10.35
|
8.42
|
| Uric Acid |
1.33%
|
17.00%
|
12.8
|
10.35
|
9.02
|
| Amylase |
2.25%
|
30.00%
|
13.3
|
18.75
|
16.5
|
| Alkaline Phosphatase |
1.79%
|
30.00%
|
16.8
|
21.05
|
19.26
|
| Triglycerides |
1.42%
|
25.00%
|
17.6
|
17.90
|
16.48
|
| CPK |
1.36%
|
30.00%
|
22.1
|
23.20
|
21.84
|
For those metrics that achieve 6 Sigma, the QC Design recommendation is a 13.5s control rule with 2 controls.
For those metrics that achieve 5 Sigma, the QC Design recommendation is a 12.5s control rule with 2 controls, or you could use a mini-"Westgard Rules" combination of 13s/22s with 2 controls.
What message can you take away from this data? That the performance of most of these methods is so good that there are rather large margins of safety for bias, despite not knowing what the bias is. This lab can still achieve world class quality with method bias issues.
A combination of data from other sources
Still the question remains, just what is the bias? Are the real world figures within the calculated tolerable bias figures?
Between 29 and 39 Roche Modular instruments participated in a recent (May 2006) testing event, which is close the same time this data was gathered, and we calculated the difference of the Roche Modular group mean from the entire testing group mean. That difference (expressed as a % of the group mean) is going to be our surrogate for bias.
Let us stress: this is not a good practice for a individual laboratory to do. We are mixing data here that really should not be mixed if we were going to make serious decisions about an individual laboratory. But this approach is as close as we can get to bias data for this study.
Below follows the calculations for bias (n/c stands for a method where no PT data was available):
| Test | Observed Imprecision |
TEa | Sigma metric | Tolerable Bias | Surrogate | |
| 5 Sigma | 6 Sigma | Bias | ||||
| Bicarbonate |
4.92%
|
12.00%
|
3.0
|
-
|
-
|
n/c |
| Direct Bilirubin |
5.17%
|
20.00%
|
3.9
|
-
|
-
|
n/c |
| Cholesterol |
2.00%
|
10.00%
|
5.0
|
0
|
-
|
1.87 |
| Glucose |
1.78%
|
10.00%
|
5.6
|
1.1
|
-
|
0.42 |
| Total Bilirubin |
3.05%
|
20.00%
|
6.6
|
4.75
|
1.7
|
11.8 |
| Total Protein |
1.64%
|
10.00%
|
6.1
|
1.8
|
0.16
|
4.23 |
| BUN |
1.56%
|
10.00%
|
6.4
|
2.2
|
0.64
|
n/c |
| Phosphorus |
2.24%
|
15.00%
|
6.7
|
3.8
|
1.56
|
0.37 |
| Lipase |
3.58%
|
25.00%
|
7.0
|
7.1
|
3.52
|
n/c |
| Creatinine |
1.98%
|
15.00%
|
7.6
|
5.1
|
3.12
|
1.97 |
| LDH |
2.57%
|
20.00%
|
7.8
|
7.15
|
4.58
|
13.87 |
| SGOT |
2.41%
|
20.00%
|
8.3
|
7.95
|
5.54
|
n/c |
| Albumin |
1.09%
|
10.00%
|
9.2
|
4.55
|
3.46
|
1.53 |
| HDL-Cholesterol |
3.13%
|
30.00%
|
9.6
|
14.35
|
11.22
|
n/c |
| Calcium |
1.70%
|
16.67%
|
9.8
|
8.17
|
6.47
|
2.9 |
| SGPT |
1.93%
|
20.00%
|
10.4
|
10.35
|
8.42
|
n/c |
| Uric Acid |
1.33%
|
17.00%
|
12.8
|
10.35
|
9.02
|
2.16 |
| Amylase |
2.25%
|
30.00%
|
13.3
|
18.75
|
16.5
|
10.9 |
| Alkaline Phosphatase |
1.79%
|
30.00%
|
16.8
|
21.05
|
19.26
|
1.64 |
| Triglycerides |
1.42%
|
25.00%
|
17.6
|
17.90
|
16.48
|
1.3 |
| CPK |
1.36%
|
30.00%
|
22.1
|
23.20
|
21.84
|
n/c |
Given the surrogate bias, we find that most of the analytes can be expected to continue to perform at the Six Sigma level. Where the bias number is italicized, that indicates a bias higher than the calculated tolerances, which would indicate a lower than 5 Sigma method, requiring more rules, possibly even more controls. In the eleven instances where methods achieved Six Sigma, there were only three cases where the surrogate bias knocked them down below Six Sigma.
Conclusions
This is an instance where there is a lot of good news. For this instrument, even in the absence of reliable bias data, it can be estimated that most of the analytes can use wide limits like 3.5s with only two controls and still tolerate a method bias.
For a laboratory that had this instrument, it would be advisable to minimize the QC efforts on most of the analytes, concentrating on just the two or three methods at the top of the table that have proven to be troublesome. Indeed, the performance of those methods were found to be outside the manufacturer's specifications (i.e. somehow broken) and this instrument was scheduled for replacement.
