Sigma Metric Analysis
Sysmex SE 9500
An analysis of the Sysmex SE-9500
- The CVs and Sigma metrics
- Leukocytes (WBC)
- Erythrocytes (RBC)
- Hemoglobin
- Platelets
- Reticulocyte
- Conclusions
September 2006
 |
[Note: This QC application is an extension of the lesson From Method Validation to Six Sigma: Translating Method Performance Claims into Sigma Metrics. This article assumes that you have read that lesson first, and that you are also familiar with the concepts of QC Design, Method Validation, and Six Sigma. If you aren't, follow the link provided.] |  |
One of the posters at the 2006 AACC/ASCLS convention discussed the Sigma metrics of a Sysmex 9500 hematology analyzer: "Performance evaluation of Hematology assays on Sysmex SE 950 analyzer using sigma-metrics", D. Pliger, F. A. Berlitz, F. Fernandes, F. Silva, S. Garcia, T. Moreira. Weinmann Laboratory, Porto Alegre, Brazil. We contacted the authors and asked them for further details on their poster.
This data was supplied from a Sysmex 9500 running three levels of control, and includes the following analytes: WBC, RBC, HB, Platelets and Reticulocytes. For most of these analytes, monthly CV and bias data were supplied for the time period from November through March. The CV and bias for all three levels were calculated. An average of those figures was used to determine QC Design and selection.
The CVs and Sigma metrics
The TEa column lists the Total Allowable Error, as specified by the CLIA proficiency testing criteria. For Reticulocyte, which has no CLIA mandated quality requirement, data from the biological variation database was used to calculate an Biologic Total Error (TEba). The EZ Rules(r) 3 software was used to perform QC Design, generate OPSpecs charts, and recommend the proper control rules.
Leukocytes (WBC )
| WBC TEa=15% | Observed Imprecision |
Observed bias |
Sigma metric | QC Rule Recommendation |
| November |
3.33%
|
1.06%
|
4.19
|
13s/2of32s/R4s/31s N=3 |
| December |
3.32%
|
1.06%
|
4.20
|
13s/2of32s/R4s/31s N=3 |
| January |
3.03%
|
1.7%
|
4.38
|
13s/2of32s/R4s/31s N=3 |
| February |
2.93%
|
1.7%
|
4.53
|
12.5s N=3 |
| March |
3.37%
|
2.26%
|
3.8
|
12.5s N=6 |
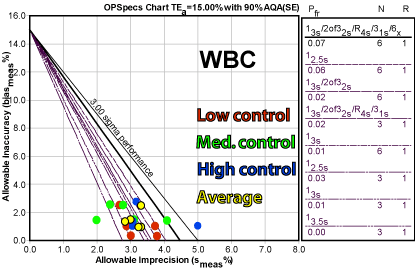
The method hovers around a low four Sigma process, which generates a recommendation of multiple "Westgard Rules" with three controls.
If we look at all these points, there is clearly a wide variety of performance.
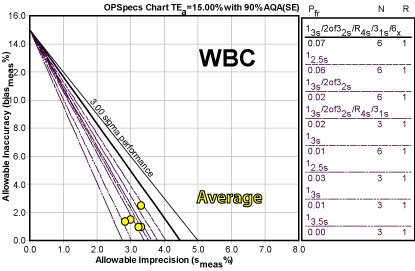
The approach taken by this laboratory was to average the results, which provides a concentrated cluster of operating points. If the laboratory is reluctant to designate one critical level, using the average provides an alternative.
Erythrocytes (RBC)
| RBC TEa=6% | Observed Imprecision |
Observed bias |
Sigma metric | QC Rule Recommendation |
| November |
1.33%
|
1.22%
|
3.59
|
13s/2of32s/R4s/31s N=6 |
| December |
1.25%
|
1.22%
|
3.83
|
12.5s N=6 |
| January |
0.73%
|
0.98%
|
6.84
|
13.5s N=3 |
| February |
0.77%
|
0.98%
|
6.54
|
13.5s N=3 |
| March |
0.80%
|
0.55%
|
6.8
|
13.5s N=3 |
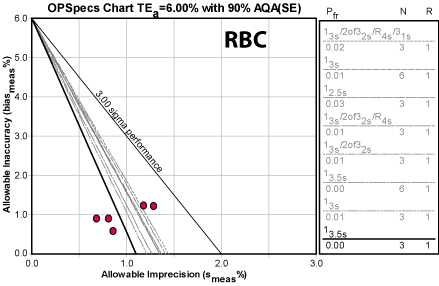
Note that the CLIA quality requirement is quite tight. Given that, even a little extra variation or bias can easily cause trouble. So what we see here is a bit of a spread here of recommendatinos. Even though there is only about 0.5% difference betwwen the lowest and highest CV figures, that's the difference between a 3 Sigma and a 6 Sigma process. So the first month of data leads to a recommendation of multiple "Westgard Rules" with twice the controls, but the rest of the recommendations are more reasonable.
Hemoglobin
| HB TEa=7% | Observed Imprecision |
Observed bias |
Sigma metric | QC Rule Recommendation |
| November |
1.10%
|
0.23%
|
6.16
|
13.5s N=3 |
| December |
1.12%
|
0.23%
|
6.07
|
13.5s N=3 |
| January |
0.77%
|
0.64%
|
8.29
|
13.5s N=3 |
| February |
0.73%
|
0.64%
|
8.67
|
13.5s N=3 |
| March |
0.70%
|
0.39%
|
9.4
|
13.5s N=3 |
Obviously, the numbers here are not only good, they're great. Even the worst number is still above Six Sigma. This method is world class.
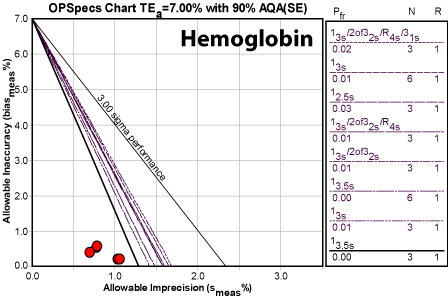
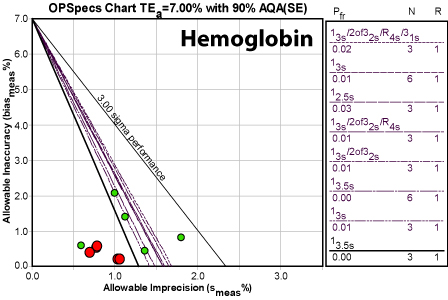
Just out of curiosity, here's how this method's performance stacks up against the New York Proficiency Testing group (a small sample of 4 instruments, 5 PT samples, 1 event):
Platelets
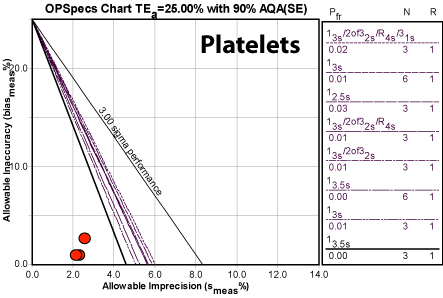
| Platelets TEa=25% | Observed Imprecision |
Observed bias |
Sigma metric | QC Rule Recommendation |
| November |
2.57%
|
2.98%
|
8.58
|
13.5s N=3 |
| January |
2.33%
|
1.24%
|
10.18
|
13.5s N=3 |
| March |
2.27%
|
1.27%
|
10.50
|
13.5s N=3 |
Again, a fantastic method. We note that only three months of data are actually present, but the picture they paint is strikingly clear. The CLIA goal is pretty wide, which allows for much higher variation and bias than the previous methods. This method is not one to worry about.
Reticulocyte
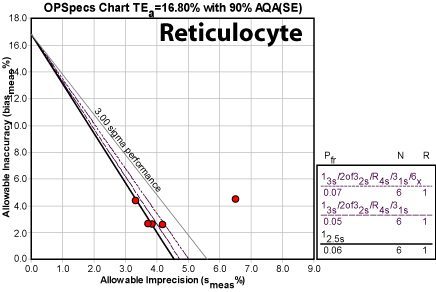
| Reticulocyte TEa=16.8% | Observed Imprecision |
Observed bias |
Sigma metric | QC Rule Recommendation |
| November |
3.33%
|
4.32%
|
3.74
|
13s/2of32s/R4s/31s N=6 |
| December |
6.60%
|
4.32%
|
1.89
|
Maximum QC |
| January |
4.13%
|
2.54%
|
3.45
|
13s/2of32s/R4s/31s/6x N=6 |
| February |
3.93%
|
2.54%
|
3.62
|
13s/2of32s/R4s/31s N=6 |
| March |
2.27%
|
1.27%
|
10.5
|
12.5s N=6 |
Here is the problem child of this set. There is considerable fluctuation in the CV. The recommendation of Maximum QC for the December event indicates that the performance of the method is below 3.0 (the lower limits of what most industries consider minimal stability). As you can see, there is one operating point that is out in deep water - it might be worth considering if that is actually an outlier. That is, something went wrong that month that wasn't detected. Nevertheless, even the other months dictate the use of many "Westgard Rules" and a double of the number of measurements. If controls can't be doubled on this method, or there is no way to double the number of readings per control, another non-statistical way of increasing vigilance and monitoring must be adopted.
Conclusions
This is another instance where there is a lot of good news. The Sysmex 9500 has world class performance for this laboratory, delivering better than Six Sigma for three analytes, two analytes with around 4 Sigma performance, and one problem method.
The biggest challenge is reconciling the QC for all these methods. The Six Sigma methods need little QC, while the problem methods need a lot more. Is it possible to do more QC for some methods on this instrument, while doing less on others? Is it possible to use different limits on different methods on this instrument? How does a laboratory balance the QC data from month to month, particularly when one month provides bad metrics while the rest are good?
This is where instrument manufacturers can provide better options for their customers. It's also the time for laboratory professionals to exercise their judgment on how to implement QC practically and optimally.
