Sigma Metric Analysis
Sysmex XT 2000i
This is a rare opportunity: to analyze multiple performance studies on a single instrument. By looking back through two scientific journals, we were able to find studies around the world that describe the performance of the Sysmex XT 2000i.
January 2007
 |
[Note: This QC application is an extension of the lesson From Method Validation to Six Sigma: Translating Method Performance Claims into Sigma Metrics. This article assumes that you have read that lesson first, and that you are also familiar with the concepts of QC Design, Method Validation, and Six Sigma. If you aren't, follow the link provided.] |  |
We recently found a rare opportunity to analyze multiple performance studies on a single instrument. By looking back through two scientific journals, we were able to find studies around the world that describe the performance of the same instrument, in this case, a Sysmex XT 2000 i instrument.
| Study | Imprecision Study details | Bias Study details |
| Performance Evaluation of the Sysmex XT-2000i Automated Hematology Analyzer, K.Langford, L. Luchtman-Jones, R. Miller, D. Walck, Laboratory Hematology 9:29-37, 2003. USA. | Closed-tube analysis of 10 consecutive measurements. Within-run. Averaged CV. | Method comparison study with XE-2100 as reference method, N=114 |
| Evaluation of the Sysmex XT-2000i, a New Automated Haematology Analyser, Wim van der Meer, Jacqueline MB Dinnissen, Marinus H de Keuzer, Sysmex Journal International Vol. 12 No. 2 (2002). The Netherlands. | 10 consecutive measurements from single specimen analysed in manual mode. Within-run. Results for three levels | Method comparison study with XE-2100 as refereence method, N=200 |
| Performance Characteristics of the Sysmex XT-2000i Hematology Analyzer, B. Fernandes, Y. Hamaguchi, Laboratory Hematology, 9:189-197, 2003. Canada/Japan. | Per NCCLS EP5-A, a total imprecision study was performed with 2 levels of quality control run up to three times per day, carried out over a period of 30 days | Method comparison study with XE-2100 with 265 patients and healthy volunteers |
The CVs and Sigma metrics
The TEa column lists the Total Allowable Error, as specified by the CLIA proficiency testing criteria. For Reticulocyte, which has no CLIA mandated quality requirement, data from the biological variation database was used to calculate an Biologic Total Error (TEba). The EZ Rules(r) 3 software was used to perform QC Design, generate OPSpecs charts, and recommend the proper control rules.
Leukocytes (WBC )
| WBC TEa=15% | Imprecision | Bias | Sigma metric | QC Rule Recommendation |
| Canada/Japan Study | ||||
| Low |
2.5%
|
1.31%
|
5.48
|
13.5s N=3 |
| Normal |
1.65%
|
1.47%
|
8.18
|
13.5s N=3 |
| High |
1.28%
|
2.42%
|
9.85
|
13.5s N=3 |
| Netherlands Study | ||||
| Low |
1.9%
|
2.91%
|
6.36
|
13.5s N=3 |
| Normal |
1.44%
|
2.04%
|
9.00
|
13.5s N=3 |
| High |
2.1%
|
1.83%
|
6.95
|
13.5s N=3 |
| USA Study | ||||
| Averaged results |
1.81%
|
2.04%
|
7.15
|
13.5s N=3 |
| Average of All Results |
1.71
|
2.37
|
7.38
|
13.5s N=3 |
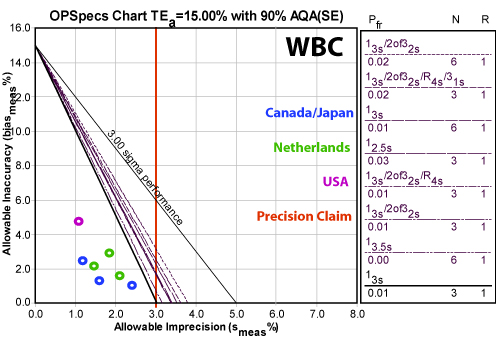
Not much needs to be said here. The method is world class.
Note the red vertical line displays the instrument claim by Sysmex of 3.0% CV or lower. The data suggest the instrument easily meets that claim.
Erythrocytes (RBC)
| RBC TEa=6% | Imprecision | Bias | Sigma metric | QC Rule Recommendation |
| Canada/Japan Study | ||||
| Low |
1.04%
|
2.0%
|
3.84
|
12.5s N=6 |
| Normal |
0.80%
|
2.0%
|
4.98
|
13s N=3 |
| High |
0.66%
|
2.0%
|
6.04
|
13.5s N=3 |
| Netherlands Study | ||||
| Low |
0.29%
|
2.71%
|
11.35
|
13.5s N=3 |
| Normal |
0.75%
|
0.51%
|
7.32
|
13.5s N=3 |
| High |
0.57%
|
0.91%
|
8.94
|
13.5s N=3 |
| USA Study | ||||
| Averaged results |
0.6%
|
0.24%
|
9.6
|
13.5s N=3 |
| Average of All Results |
0.67%
|
1.48%
|
7.44
|
13.5s N=3 |
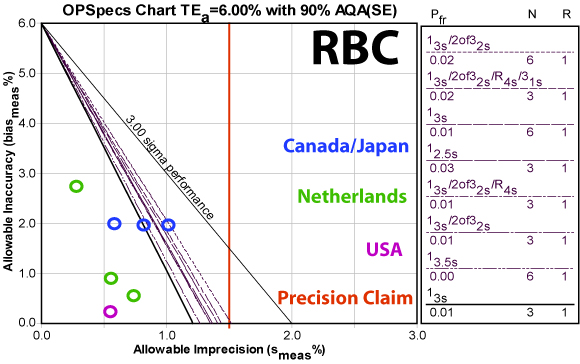
Note that the CLIA quality requirement is quite tight. But even given that, only the low control of one of the studies falls significantly below Six Sigma.
Note again that the studies show the instrument beating the precision claim by a wide margin.
Hemoglobin
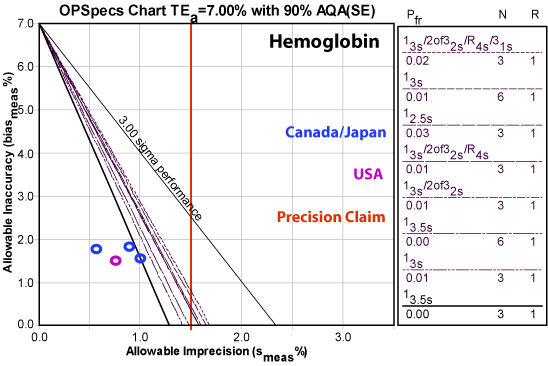
| Hemoglobin TEa=7% | Imprecision | Bias | Sigma metric | QC Rule Recommendation |
| Canada/Japan Study | ||||
| Low |
1.09%
|
1.69%
|
4.85
|
12.5s N=3 |
| Normal |
0.56%
|
1.84%
|
9.26
|
13.5s N=3 |
| High |
0.94%
|
1.88%
|
5.43
|
13s N=3 |
| Netherlands Study - not included | ||||
| USA Study | ||||
| Averaged results |
0.4%
|
0.81%
|
15.48
|
13.5s N=3 |
| Average of All Results |
0.75%
|
1.56%
|
7.27
|
13.5s N=3 |
The Netherlands study did not provide imprecision numbers for Hemoglobin, so we rely on just two studies for this analyte. While not every number is world class, performance here is again overwhelmingly excellent, easily beating the claimed precision.
Platelets
| Platelets TEa=25% | Imprecision | Bias | Sigma metric | QC Rule Recommendation |
| Canada/Japan Study | ||||
| Low |
6.05%
|
6.00%
|
3.14
|
13s/2of32s/R4s/31s/6x N=6 |
| Normal |
2.46%
|
0.83%
|
9.82
|
13.5s N=3 |
| High |
1.83%
|
2.13%
|
12.52
|
13.5s N=3 |
| Netherlands Study | ||||
| Low |
3.64%
|
2.91%
|
6.07
|
13.5s N=3 |
| Normal |
3.44%
|
0.21%
|
7.21
|
13.5s N=3 |
| High |
1.34%
|
1.14%
|
17.81
|
13.5s N=3 |
| USA Study | ||||
| Averaged results |
2.00%
|
5.49%
|
9.76
|
13.5s N=3 |
| Average of All Results |
2.96%
|
2.67%
|
7.53
|
13.5s N=3 |
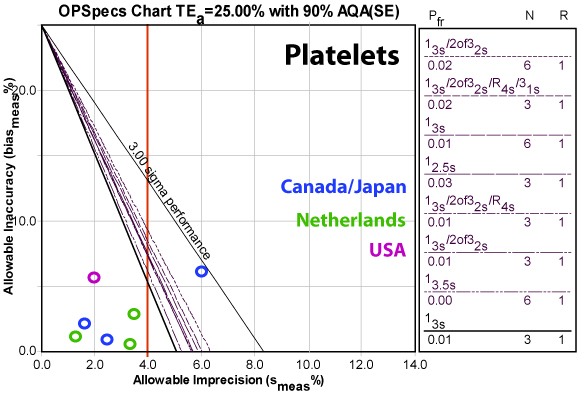
With the exception of the low control in the Canadian and Japanese study, this analyte is world class. That one point is also beyond the precision claim, while the rest of the data is below.
Conclusions
This is another instance where there is a lot of good news. The Sysmex XT-2100i achieves world class performance for nearly all the analytes at nearly all levels. The fact that different laboratories achieved this level of performance provides additional confidence in the instrument.
