Sigma Metric Analysis
ADVIA 1800
A look at 2007 poster data evaluating performance of the ADVIA 1800 chemistry system. From the 2007 AACC/ASCLS annual meeting.
- The Precision and Comparison data
- Calculate bias at the critical decision level
- Determine quality requirements at the critical decision level
- Calculate Sigma metrics
- Summary of Performance by Normalized OPSpecs Chart
- Taking control over even the most difficult methods
- Conclusions
September 2007 - data corrected 9/25/07
 |
[Note: This QC application is an extension of the lesson From Method Validation to Six Sigma: Translating Method Performance Claims into Sigma Metrics. This article assumes that you have read that lesson first, and that you are also familiar with the concepts of QC Design, Method Validation, and Six Sigma. If you aren't, follow the link provided.] |  |
This application comes from another set of posters from the AACC/ASCLS annual meeting. This conference has become about the only source of method evaluation data on instrument performance.
In this example, we're going to take a look at a method validation study performed for the ADVIA 1800 Clinical Chemistry System (D-26: JS Branch, L Burke, RC Magcauas, SF Gross, AH Wu, Evaluation of the New ADVIA 1800 Chemistry System).
The Precision and Comparison data
According to the abstract, this evaluation study adhered closely to CLSI (formerly NCCLS) protocols, calculating total precision for two levels (duplicates, 2/day, 20 days) as well as the more common (and more attractively smaller) within-run precision figures. Also, they provided specific comparison study data. All that we need to do is supply the quality requirements and calculate the Sigma metrics.
Imprecision Estimates:
| Assay |
Level
|
N
|
CV% |
| ALB |
2.6
|
18-23
|
0.9%
|
|
4.0
|
18-23
|
1.1%
|
|
| ALKP |
89
|
18-23
|
1.8%
|
|
420
|
18-23
|
1.0%
|
|
| ALT |
30
|
18-23
|
4.0%
|
|
93
|
18-23
|
1.2%
|
|
| AST |
42
|
18-23
|
2.3%
|
|
196
|
18-23
|
1.0%
|
|
| BUN |
16
|
18-23
|
1.4%
|
|
50
|
18-23
|
1.7%
|
|
| Calcium |
7.9
|
18-23
|
1.7%
|
|
11.7
|
18-23
|
1.8%
|
|
| Chloride |
89
|
18-23
|
0.5%
|
|
103
|
18-23
|
0.5%
|
|
| Creatinine |
0.77
|
18-23
|
3.4%
|
|
5.56
|
18-23
|
2.8%
|
|
| Glucose |
87
|
18-23
|
0.9%
|
|
286
|
18-23
|
0.9%
|
|
| Potassium |
4.0
|
18-23
|
0%
|
|
6.4
|
18-23
|
0.9%
|
|
| Sodium |
136
|
18-23
|
0.4%
|
|
154
|
18-23
|
0.6%
|
|
| TBilirubin |
0.9
|
18-23
|
0%
|
|
5.0
|
18-23
|
1.2% | |
| TP |
4.2
|
18-23
|
1.2% |
|
6.5
|
18-23
|
1.1% |
Comparison of Methods Data:
Between 63 and 66 samples were run on the ADVIA 1800 and the ADVIA 1650
| Assay |
Slope
|
Y-Int
|
r
|
| ALB |
1.013
|
-0.04
|
0.9984
|
| ALKP |
0.978
|
-3.60
|
0.9969
|
| ALT |
0.979
|
-0.40
|
0.9998
|
| AST |
0.963
|
2.4
|
0.9999
|
| BUN |
1.007
|
-0.3
|
0.9997
|
| Calcium |
0.963
|
0.18
|
0.9909
|
| Chloride |
0.926
|
7.0
|
0.9333
|
| Creatinine |
0.994
|
-0.04
|
0.9990
|
| Glucose |
0.988
|
0.90
|
0.9996
|
| Potassium |
0.957
|
0.27
|
0.9953
|
| Sodium |
0.969
|
5.2
|
0.9449
|
| TBilli |
1.025
|
-0.01
|
0.9999
|
| TP |
0.997
|
-0.05
|
0.9966
|
At this point, remember the following: the correlation coefficient is not the key statistic here. The impressive values of the correlation coefficient merely tell us that linear regression is sufficient for these analytes (for those r values below 0.95, other forms of regression like Deming or Passing-Bablock are preferable, but in this case, are not available).
Calculate bias at the critical decision level
Now we take the comparison of methods data and set those equations at one of the levels covered in the imprecision studies. Solving those equations will give us bias estimates. For this illustration, we're going to select the levels where imprecision was highest, that is, a worst-case scenario approach.
Using glucose as an example, let's see how to calculating bias:
((slope*level) + YIntercept) - level) / level = % bias
((1.013 * 4.0) - 0.04) - 4.0) / 4.0
| Assay |
Slope
|
Y-Int
|
level
|
Bias% |
| ALB |
1.013
|
-0.04
|
4.0
|
0.3%
|
| ALKP |
0.978
|
-3.60
|
89
|
6.2%
|
| ALT |
0.979
|
-0.40
|
30
|
3.4%
|
| AST |
0.963
|
2.4
|
42
|
2.0%
|
| BUN |
1.007
|
-0.3
|
50
|
0.1%
|
| Calcium |
0.963
|
0.18
|
11.7
|
2.2%
|
| Chloride |
0.926
|
7.0
|
89
|
0.5%
|
| Creatinine |
0.994
|
-0.04
|
0.77
|
5.8%
|
| Glucose |
0.988
|
0.90
|
87
|
0.2%
|
| Potassium |
0.957
|
0.27
|
6.4
|
0.1%
|
| Sodium |
0.969
|
5.2
|
154
|
0.3%
|
| TBilli |
1.025
|
-0.01
|
5.0
|
2.3%
|
| TP |
0.997
|
-0.05
|
4.2
|
1.5%
|
Determine the quality requirements at the critical decision level
Now that we have both bias and CV estimates, we are almost ready to calculate the Sigma metrics for these analytes. The last thing we need is the quality requirement for each method. CLIA provides most of the quality requirements we need, but in several cases, we need to transform those requirements into useful percentages.
| Assay | CLIA PT criterion | notes |
Final Quality Requirement
|
| Albumin |
Target value ± 10%
|
10.0%
|
|
| Alkaline Phosphatase |
Target value ± 30%
|
30.0%
|
|
| ALT |
Target value ± 20%
|
20.0%
|
|
| AST |
Target value ± 20%
|
20.0%
|
|
| BUN |
Target value ± 2 mg/dL or ± 9% (greater)
|
At 50 mg/dL, (2/50) = 4% |
9.0%
|
| Calcium |
Target value ± 1 mg/dL
|
At 11.7 mg/dL, (1/11.7) = 8.5% |
8.5%
|
| Chloride |
5%
|
5.0%
|
|
| Creatinine |
Target value ± 0.3 mg/dL or ± 15% (greater)
|
At 0.77 mg/dL (0.3/0/77) = 39% |
39.0%
|
| Glucose |
Target value ± 6 mg/dL or ± 10% (greater)
|
At 87 mg/dL (6/87) = 6.9% |
10.0%
|
| Potassium |
Target value ± 0.5 mmol/L
|
At 6.4 mmol/L (0.5/6.4) = 7.8% |
7.8%
|
| Sodium | Target value ± 4 mmol/L | At 154 mmol/L (4/154) = 2.6% |
2.6%
|
| Total Bilirubin | Target value ± 0.4 mg/dL or ± 20% (greater) | At 5.0 mg/dL (0.4/5.0) = 8% |
20.0%
|
| Total Protein | Target value ± 10% |
10.0%
|
Note that some of these requirements are extremely tight. Sodium and Potassium have a fixed target values, regardless of the level of the test, which creates very small windows of opportunity. Chloride's requirement is also quite small.
Calculate Sigma metrics
Now we have all the pieces in place.
Remember the equation for Sigma metric is (TEa - bias) / CV:
For Albumin, (10.0 - 0.3) / 1.1 = 8.8
| Assay |
Worst case CV%
|
Bias%
|
TEa%
|
Sigma metric |
| ALB |
1.1%
|
0.3%
|
10.0%
|
8.8
|
| ALKP |
1.8%
|
6.2%
|
30.0%
|
13.2
|
| ALT |
4.0%
|
3.4%
|
20.0%
|
4.15
|
| AST |
2.3%
|
2.0%
|
20.0%
|
7.8
|
| BUN |
1.7%
|
0.1%
|
9.0%
|
5.23
|
| Calcium |
1.8%
|
2.2%
|
8.5%
|
3.5
|
| Chloride |
0.5%
|
0.5%
|
5.0%
|
9.0
|
| Creatinine |
3.4%
|
5.8%
|
39%
|
9.8
|
| Glucose |
0.9%
|
0.2%
|
10.0%
|
10.9
|
| Potassium |
0.9%
|
0.1%
|
7.8%
|
8.5
|
| Sodium |
0.6%
|
0.3%
|
2.6%
|
3.83
|
| TBilli |
1.2%
|
2.3%
|
20.0%
|
14.7
|
| TP |
1.2%
|
1.5%
|
10.0%
|
7.1
|
Not much needs to be said here. 9 out the13 methods are world class. The analytes with very tight quality requirements fared worse.
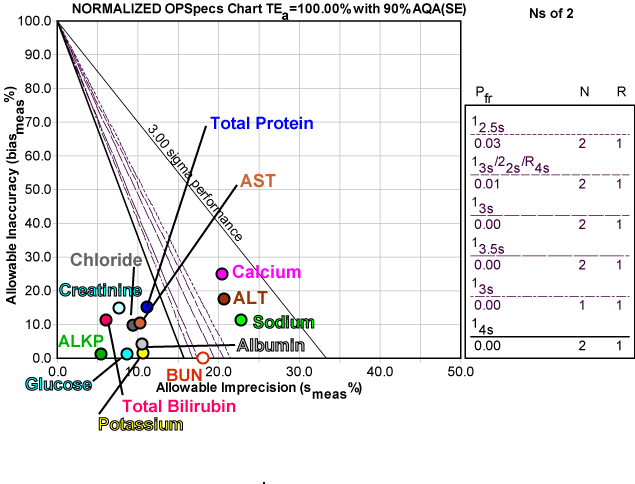
Here's a graphic depiction of these analytes, normalized so they can be presented together on a Normalized OPSpecs chart:
As you can see, there are a lot of operating points on "dry ground." For many of these analytes, there is plenty of wiggle room for variation while still maintaining world class performance.
Note also that the Normalized OPSpecs chart displays some unusual rules (see the key at right). For eight of the analytes on the Advia 1800, a single control with control limits set at three or even four times the standard deviation would provide more than sufficient error detection of medically important areas. This is one of those (somewhat rare) areas where the CLIA minimums are over-controlling those method. Since CLIA requires at least 2 controls per run, the other solutions would include control limits set at 3.5 or 4 times the standard deviation.
All of these QC procedures would essentially eliminate false rejection problems. If you set your limits that wide, you will only get a flag when there is a real problem. But remember, once you get that flag, you must do something about it (trouble-shoot the method), not just repeat the control.
Taking control of even the most difficult method
So in an instrument with a majority of great methods, how do you handle the "outlier" methods? Here's where a more detailed analysis of the method performance can help.
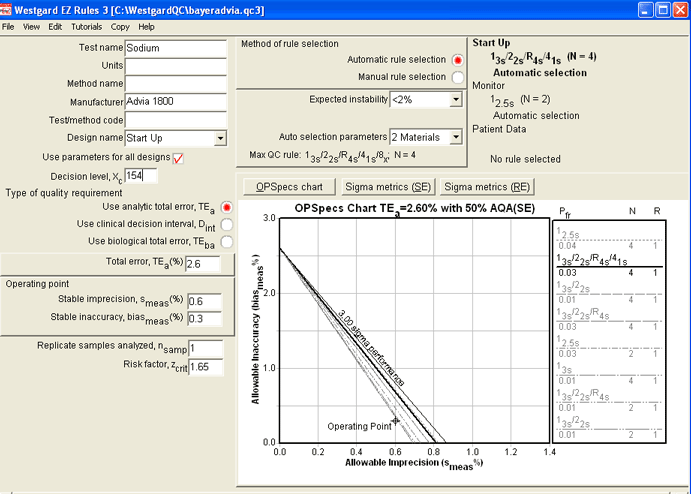
Using EZ Rules 3 (in form mode), we entered the parameters for the Sodium. When Automatic QC Selection was initiated, the same recommendation appeared: Use of a "Westgard Rules" 13s/22s/R4s/41s rule. But note two additional details about this rule:
1. It requires four control measurements per run, not two.
2. The OPSpecs chart is for 50% Analytical Quality Assurance (AQA), instead of the preferred 90% AQA. All the other methods would provide Six Sigma quality at the 90%AQA level:
Here is the Sigma-metric / Critical-Error graph which shows a more precise estimate of error detection:
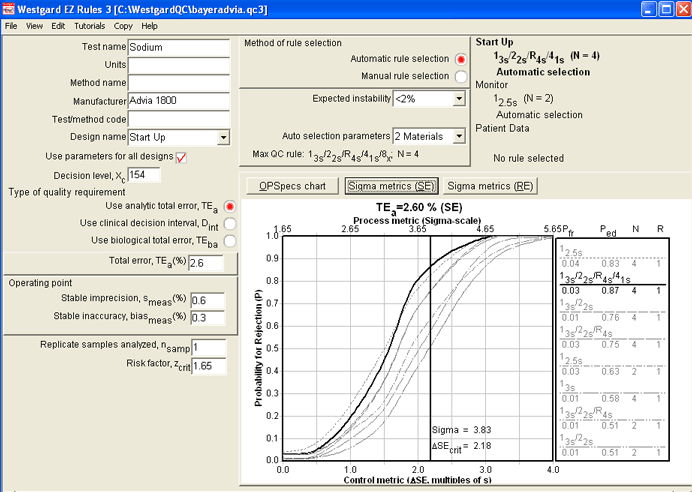
Using the second "Monitor" design part of this screen, we can look at how this method would perform if we retain the use of 2 controls. The Sigma-metrics graph reveals specific error detection of 2.5s, 3s, and 3.5s limits on this method.
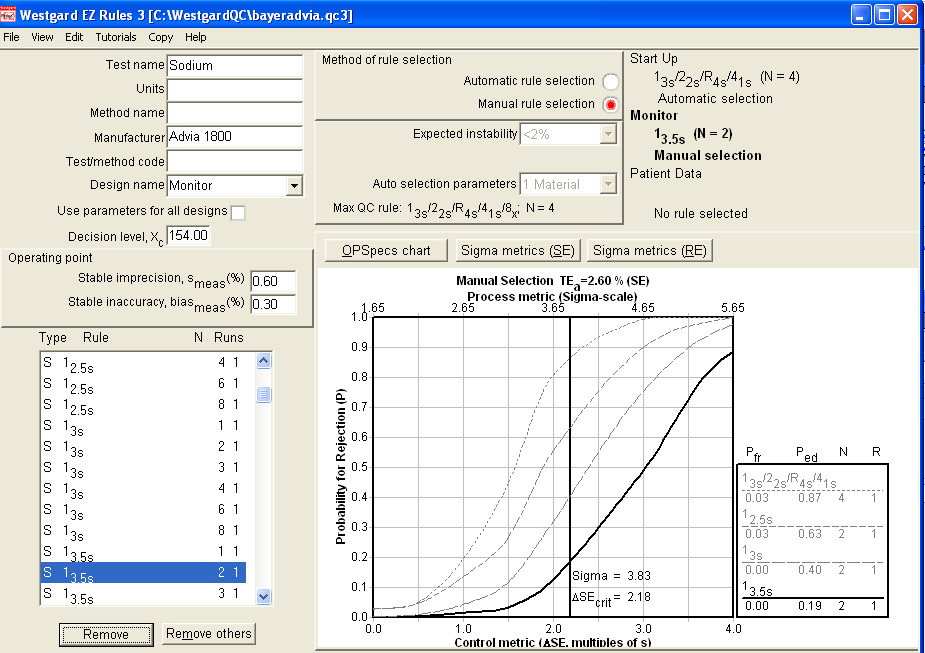
Even if we tighten up the limits, we are only reaching above 60% error detection here. That's probably not acceptable to most laboratories.
But let's return to the OPSpecs chart and try to find a different solution for this problem. For example, let's see what would happen if we could lower the imprecision from 0.6 to 0.5:
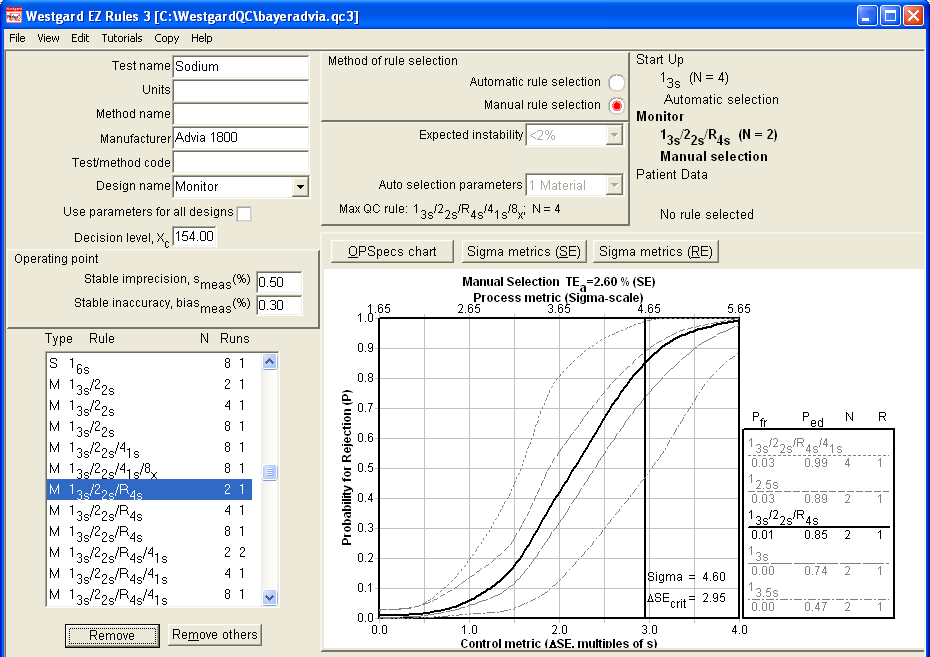
This is a good illustration of how EZ Rules lets you experiment with the impact of difference changes in performance. With just an improvement of 0.1% in precision - admittedly not an easy feat for sodium, but not rocket science - you can reach a state where Sigma is well above 4.0, and a 2 control implementation of a reduced "Westgard Rules" set will give you nearly 90% error detection (the goal) with only about 1% false rejection. Alternatively, you could also use 2.5s limits with 2 controls for slightly higher error detection and higher false rejection.
Conclusions
This is another instance where there is a lot of good news. The methods we studied from the Bayer Advia 1800 show a lot of class - world class performance. While all the methods weren't 100% perfect, if you look at comparative methods, you will see that this data represents some pretty good performance. For difficult methods, the use of QC Design tools will identify the best options for improvement.
This application also illustrates the utility of different QC Design tools. First we used a Sigma calculation to sort out which methods were world class and which methods were problematic. Then we used Normalized OPSpecs charts to visually assess these methods some more. With the problem methods, we used sophisticated computer analysis from EZ Rules 3 to examine the problem method in detail, and explore various improvement options. The first two tools are basically free, the last tool requires a purchase. But you gain much more power over your QC Design with that tool.

