Sigma Metric Analysis
Architect c16000
Our first look at Abbott's newest, biggest chemistry instrument showed interesting Sigma performance. So we decided to take a second look, using 2007 AACC conference poster data. Does an on-site evaluation corroborate the manufacturer's evaluation?
- The Precision and Comparison data
- Calculate bias at the critical decision level
- Determine quality requirements at the critical decision level
- Calculate Sigma metrics
- Summary of Performance by Normalized OPSpecs Chart
- Comparison of Manufacturer vs Site Metrics
- Conclusions
October 2007
 |
[Note: This QC application is an extension of the lesson From Method Validation to Six Sigma: Translating Method Performance Claims into Sigma Metrics. This article assumes that you have read that lesson first, and that you are also familiar with the concepts of QC Design, Method Validation, and Six Sigma. If you aren't, follow the links provided.] |  |
This application comes from another set of posters from the 2007 AACC/ASCLS annual meeting. This conference has become about the only source of method evaluation data on instrument performance.
In this example, we're going to take a look at a method validation study performed for the Abbott Architect c16000 Clinical Chemistry System (E-45: S. A. Gough, L. French-English, Medical Laboratory Staff, Site Evaluation of the Abbott Architect c16000 Clinical Chemistry).
The Precision and Comparison data
According to the abstract, this evaluation study adhered closely to CLSI (formerly NCCLS) protocols, calculating total precision using EP10, and method comparison using EP9 with the Roche Modular system as the reference method. All that we need to do is select which estimates to use, supply the quality requirements and calculate the Sigma metrics.
Imprecision Estimates:
| Assay |
Level
|
CV% |
| AST |
39
|
1.2%
|
|
180
|
0.8%
|
|
| ALKP |
97
|
2.3%
|
|
407
|
1.1%
|
|
| BILI, TOTAL |
0.7
|
1.7%
|
|
4.1
|
0.9%
|
|
| CREAT |
2.08
|
1.5%
|
|
6.18
|
1.1%
|
|
| GLUCOSE |
91
|
1.3%
|
|
296
|
1.6%
|
|
| IRON |
221
|
1.0%
|
|
64
|
2.0%
|
|
| THEO |
8.2
|
2.2%
|
|
23.6
|
2.4%
|
|
| TOTAL PROTEIN |
6.6
|
0.5%
|
|
4.3
|
0.4%
|
|
| UREA |
16
|
1.4%
|
|
47
|
1.4%
|
Comparison of Methods Data:
| Assay |
Slope
|
Y-Int
|
r
|
| AST |
0.98
|
-1.39
|
1.000
|
| ALKP |
0.93
|
0.43
|
0.999
|
| BILI TOTAL |
1.07
|
0.09
|
0.993
|
| CREATININE |
0.98
|
0.17
|
0.998
|
| GLUCOSE |
1.02
|
-0.80
|
0.975
|
| IRON |
1.00
|
-3.00
|
1.000
|
| THEO |
0.95
|
-0.02
|
0.992
|
| TOTAL PROTEIN |
0.95
|
0.19
|
0.997
|
| UREA |
1.03
|
-0.64
|
0.999
|
At this point, remember the following: the correlation coefficient is not the key statistic here. The impressive values of the correlation coefficient merely tell us that linear regression is sufficient for these analytes (for those r values below 0.95, other forms of regression like Deming or Passing-Bablock are preferable, but in this case, are not available).
Calculate bias at the critical decision level
Now we take the comparison of methods data and set those equations at one of the levels covered in the imprecision studies. Solving those equations will give us bias estimates. For this illustration, we're going to select the levels where imprecision was highest, that is, a worst-case scenario approach.
Using glucose as an example, let's see how to calculating bias:
((slope*level) + YIntercept) - level) / level = % bias
((1.02 * 91.0) - 0.8) - 91) / 91 = ((92.82 - 0.8) - 91 ) / 91
(92.02-91) / 91 = 1.02 / 91 = 0.0112 * 100 = 1.1%
| Assay |
Slope
|
Y-Int
|
level
|
Bias% |
| AST |
0.98
|
-1.39
|
39
|
5.6%
|
| ALKP |
0.93
|
0.43
|
97
|
6.5%
|
| BILI TOTAL |
1.07
|
0.09
|
4.1
|
9.2%
|
| CREATININE |
0.98
|
0.17
|
2.08
|
6.2%
|
| GLUCOSE |
1.02
|
-0.8
|
91
|
1.1%
|
| IRON |
1.00
|
-3.00
|
221
|
1.3%
|
| THEO |
0.95
|
-0.02
|
8.2
|
5.2%
|
| TOTAL PROTEIN |
0.95
|
0.19
|
4.3
|
0.6%
|
| UREA |
1.03
|
-0.64
|
47
|
1.6%
|
Determine the quality requirements at the critical decision level
Now that we have both bias and CV estimates, we are almost ready to calculate the Sigma metrics for these analytes. The last thing we need is the quality requirement for each method. CLIA provides most of the quality requirements we need, but in several cases, we need to transform those requirements into useful percentages.
| Assay | CLIA PT criterion | notes |
Final Quality Requirement
|
| AST |
Target value ± 20%
|
20.0%
|
|
| ALKP |
Target value ± 30%
|
30.0%
|
|
| BILI TOTAL |
Target value ± 0.4 mg/dL or ± 20% (greater)
|
At 4.1 mg/dL, (0.4/4.1) = 9.7% |
20.0%
|
| CREATININE |
Target value ± 0.3 mg/dL or ± 15% (greater)
|
At 2.08 mg/dL, (0.3/2.08) = 14.4% |
15.0%
|
| GLUCOSE |
Target value ± 6 mg/dL or ± 10% (greater)
|
At 91 mg/dL, (6/91) = 6.6% |
10.0%
|
| IRON |
Target value ± 20%
|
20.0%
|
|
| THEO |
Target value ± 25%
|
25.0%
|
|
| TOTAL PROTEIN |
Target value ± 10%
|
10.0%
|
|
| UREA |
Target value ± 2 mg/dL or ± 9% (greater)
|
At 47 mg/dL, (2/47) = 4.2% |
9.0%
|
Note that some of these requirements are extremely tight. Sodium and Potassium have a fixed target values, regardless of the level of the test, which creates very small windows of opportunity. Chloride's requirement is also quite small.
Calculate Sigma metrics
Now we have all the pieces in place.
Remember the equation for Sigma metric is (TEa - bias) / CV:
For Glucose, (10.0 - 1.1) / 1.3 = 6.85
| Assay |
CV%
|
Bias%
|
TEa%
|
Sigma metric |
| AST |
1.2%
|
5.6%
|
20.0%
|
12.00
|
| ALKP |
2.3%
|
6.5%
|
30.0%
|
10.21
|
| BILI TOTAL |
0.9%
|
9.2%
|
20.0%
|
12.00
|
| CREATININE |
1.5%
|
6.2%
|
15.0%
|
5.87
|
| GLUCOSE |
1.3%
|
2.0%
|
10.0%
|
6.15
|
| IRON |
1.0%
|
1.3%
|
20.0%
|
18.70
|
| THEO |
2.2%
|
5.2%
|
25.0%
|
9.00
|
| TOTAL PROTEIN |
0.4%
|
0.6%
|
10.0%
|
23.50
|
| UREA |
1.4%
|
1.6%
|
9.0%
|
5.28
|
Not much needs to be said here. 7 out the 9 methods are world class. Even the lowest Sigma metrics (for Creatinine and Urea) are nearly at Six Sigma performance.
Summary of Performance by Normalized OPSpecs chart
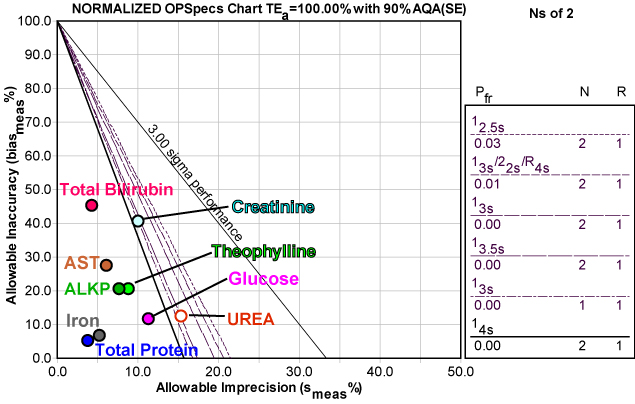
Here's a graphic depiction of these analytes, normalized so they can be presented together on a Normalized OPSpecs chart:

As you can see, most of the operating points are on "solid ground." For many of these analytes, there is a great deal of wiggle room (allowable variation) available to them without jeopardizing world class performance.
Note also that the Normalized OPSpecs chart displays some unusual rules (see the key at right). For seven of the analytes on the Architect c16000, a single control with control limits set at three or even four times the standard deviation would provide more than sufficient error detection of medically important errors. This is one of those (somewhat rare) areas where the CLIA minimums are over-controlling those methods. Since CLIA requires at least 2 controls per run, the other solutions displayed here show control limits set at 3.5 and 4 times the standard deviation. Even the two "problem" methods, Urea and Creatinine, can still be adequately controlled with 2 controls and limits set at 3s.
All of these QC procedures would essentially eliminate false rejection problems. If you set your limits that wide, you will only get a flag when there is a real problem. But remember, once you get that flag, you must do something about it (trouble-shoot the method), not just repeat the control.
Comparison of Sigma Metrics from Manufacturer's Evaluation and Site Evaluation
We are lucky enough to have two evaluations of this instrument. Two sets of data were presented as posters at the AACC/ASCLS conference. The former set was detailed in an earlier QC Application While not every analyte was shared by the two evaluations, there were five tests that were analyzed in common by the two studies. Given the chance to compare Sigma metrics, it is interesting to see if there are any similarities or differences:
| Assay |
Abbott Metric
|
Site metric
|
| BILI TOTAL |
11.94
|
12.00
|
| CREATININE |
5.83
|
5.87
|
| GLUCOSE |
5.92
|
6.85
|
| TOTAL PROTEIN |
14.8
|
23.50
|
| UREA |
3.21
|
5.28
|
There is a definite consistency of metrics. In theory, this is exactly what should occur; the instruments should behave the same, regardless of setting, particularly given the level of automation and sophistication. The only real difference here is between the Abbott measurement and the Site measurement of Urea performance. What's more, the difference is good news - the laboratory performed better than the manufacturer. Indeed, the manufacturer metrics are all lower than the site evaluation, suggesting a conservative approach adopted by their testing.
Finally, the biggest difference, of 23.5 versus 14.8 Sigma for Total Protein, is actually an irrelevant difference. Once you've exceeded Six Sigma, there is no practical significance to a metric of 10, 14, 23 or higher (unless the quality requirement is tightened - then the recalculated metric will be significantly different).
Conclusions
As we have said before, it is rare to find so much good news in a method evaluation study. If this were your laboratory and your data, it would be time to celebrate.
