Questions
Quintiles and Quality: QC for hs-CRP
There have been several questions recently about how to set a quality requirement, specifically a precision requirement, for the high sensitivity C-reactive protein test (hs-CRP). There certainly is a lot of interest and demand for hs-CRP these days because of published studies that show a correlation of elevated baseline values with a higher risk of future cardiovascular events. Cardiologists are clamoring for the test because of the discussions in the scientific literature and professional meetings.
- What are the quintiles of risk?
- Why quintiles?
- What is the effect of within-subject biological variation?
- Can quartiles defend quintiles?
- Is imprecision even the issue?
- Why not a gray zone?
- References
What are quintiles of risk?
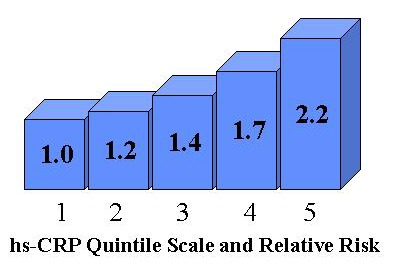
hs-CRP is a test where data interpretation is based on "quintiles of risk." In an opinion paper in the journal of Clinical Chemistry [1], Rifai and Ridker proposed a risk assessment algorithm based on a series of five clinical cutpoints for hs-CRP (hence the name "quintiles"). The recommended quintiles are as follows:
| Quintile 1 | Lowest Risk | 0.1-0.7 mg/L hs-CRP |
| Quintile 2 | Low Risk | 0.7-1.1 |
| Quintile 3 | Moderate Risk | 1.2-1.9 |
| Quintile 4 | High Risk | 2.0-3.8 |
| Quintile 5 | Highest Risk | 3.9-15.0 |
Relative Risk (RR) can be described graphically using a "column-plot" where the height of the column expresses the risk, as illustrated here. In the proposed risk assessment algorithm, a second risk factor - the ratio of total cholesterol to HDL cholesterol - is included and plotted on another axis to produce a three-dimensional column plot. However, to keep things simple, I will focus solely on hs-CRP in this discussion.
Why quintiles?
In the original study of the hs-CRP ELISA method, group and individual variation were assessed to investigate the suitability of the test for clinical vs epidemiological applications [2]. The authors concluded that "CRP, like many clinical chemistry analytes, has limited usefulness in detecting early disease associated changes when used in conjunction with a healthy reference interval." At that time, the generally accepted clinical cutoff was 10 mg/L.
Levinson [3] has pointed out that hs-CRP reference intervals vary for males and females, women with hormone replacement therapy, smokers and non-smokers, obesity, and age. He suggests that quintiles have been adopted because of the difficulties of using reference intervals that depend on so many factors.
The other reason for using quintiles is that the data has been analyzed this way in the large epidemiologic studies that are being conducted. Epidemiologic studies depend on large amounts of data. The overall trends depend on the "averages" that are observed. The data analysis is designed to minimize, or average out, the effects of random variation. This is in stark contrast to the interpretation of an individual patient test result, which may be greatly affected by random variation, both analytical and within-subject biological variation. Sources of random variation may cause an individual patient to be classified in different quintiles and therefore may limit the usefulness of hs-CRP for treatment of individual patients.
What is the effect of within-subject biological variation?
I asked Callum Fraser for information about within-subject biological variation and he referred me to a recent paper by Campbell et al [4]. This paper summarizes information about within-subject biological variation found in earlier papers [2,5-6]. Note that reference 2 is from Tracy, who developed the high sensitivity CRP method used in much of the original investigative work.
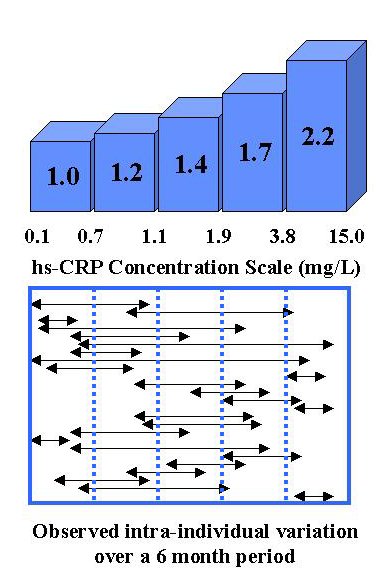
To illustrate the magnitude of within-subject biologic variability, this second figure shows the range of observations for individual patients on the same concentration scale as the quintiles cutoffs. This data comes originally from Tracy [2] and is discussed further by Campbell [4]. Many individuals would be classified in different quintiles of risk if hs-CRP were measured over time. Two individuals in this group of 26 would actually have been classified as "lowest risk" at one time and "highest risk" at another time. If that holds true for the general population, that means about 8% of the population may change in classification from lowest to highest risk, or vice versa, depending on when they happen to be measured.
Can quartiles defend quintiles?
In defense of the risk classification scheme, Octene et al [7] studied the agreement in classification on the 1st and 2nd measurements of a group of 113 individuals and found that 63% were classified the same and 90% were within one quartile of each other. Yes, quartiles were used instead of quintiles, even though the purpose of the study was to defend the use of hs-CRP for risk classification. Quartile 4 used a cutoff of 2.0 mg/L, which effectively combines quintiles 4 and 5. Quartile 3 covered the range of 1.00 to 1.99, which is somewhat wider than quintile 3 (1.2-1.9). Quartile 1 was defined as values of 0.5 mg/L or less, which was somewhat narrower than quintile 1, leaving quartile 2 somewhat broader than quintile 2.
In these days of evidence based medicine, this is a good example of monkeying with the evidence and adding to the confusion, rather than clarifying the application. There's no doubt that the statistical analysis is rigorous, but the study is not very helpful when the classification scheme has been changed. It's no wonder that the utilization of laboratory tests is NOT rational, given that the scientific studies and documentation are not consistent.
Is imprecision even the issue?
The precision performance of the analytical method is certainly important, but it is difficult to define an objective goal. When there are multiple cutoffs and classifications, as in the proposed risk assessment algorithm, there is no room for any analytical imprecision. The smaller the method CV, the more accurate the classification of patients, BUT, the allowable CV is really zero (and so is the allowable bias).
The real issue with hs-CRP is the efficacy of the test when used to classify the future risks for individual patients. What is good when applied to a large population is not necessarily useful when applied to individuals within that population. Many individuals will be misclassified in terms of their future risks.
Why not a gray zone?
The hs-CRP test would seem to be of more practical value if the risk assessment algorithm were simplified to define only low risk and high risk groups, leaving a gray zone between them. This would be similar to the NCEP interpretation guidelines for cholesterol, where 200 mg/dL cholesterol is the cutoff for the low risk group and 240 mg/dL is the cutoff for the high risk group. This leaves a gray zone of 40 mg/dL as a safety margin to absorb pre-analytical and analytical sources of variation and to prevent damage from misclassification.
As laboratory scientists, we need to continually remind clinicians of the confounding complications of sources of variability, both analytical and pre-analytical. When we provide tests with multiple cutoffs, we imply that those cutoffs are reliable and not affected by known factors of variability. We imply that the test results are more reliable than they really are. We contribute to the misuse and misinterpretation of laboratory tests in our efforts to provide more diagnostic sensitivity. We forget that diagnostic specificity is usually inversely affected and overlook the consequences of false classifications.
Our knowledge of these complications is part of what we can contribute to evidence based medicine. Quality often depends on prevention of problems. We have an opportunity to improve quality by the proper test interpretation guidelines. Poor strategies for test interpretation contribute to poor quality laboratory tests.
References
- Rifai N, Ridker PM. Proposed cardiovascular risk assessment algorithm using high-sensitivity C-reactive protein and lipid screening. Clin Chem 2001;47:28-30.
- Macey EM, Hayes TE, Tracy RP. Variability in the measurement of C-reactive protein in healthy subjects: implications for reference intervals and epidemiological applications. Clin Chem 1997;43:52-58.
- Levinson SS. Will CRP actually be useful in assessing risk of cardiovascular disease? Fats of Life Newsletter. Volume XVI No 2, Spring 2002.
- Campbell B, Badrick T, Flatman R, Kanowski D. Limited clinical utility of high-sensitivity plasma C-reactive protein assays. Ann Clin Biochem 2002;39:85-88.
- de Maat MPM, de Bart ACW, Hennis BC, et al. Interindividual and intraindividual variability in plasma fibrinogen, TPA antigen, PAI activity, and CRP in healthy, young volunteers and patients with angina pectoris. Arterioscler Thromb Vasc Biol 1996;16:1156-1162.
- Clark GH, Fraser CG. Biological variation of acute phase proteins. Ann Clin Biochem 1993;30:373-376.
- Ockene IS, Matthews DE, Rifai N, Ridker PM, Reed G, Stanek E. Variability and classification accuracy of serial high-sensitivity C-Reactive Protein measurements in healthy adults. Clin Chem 2001;47:444-450.