Guest Essay
Saving money by applying TEa and Six Sigma for internal QC.
Putting Sigma-metrics into action can have tangible results in the laboratory. This guest essay highlights the impact of redesigning QC based on Six Sigma concept in several hospitals in the Netherlands
Saving money by applying TEa and Six Sigma for internal QC.
July 2011
Hans van Schaik
Core Analyst quality assurance and process control
Department of clinical chemistry
Sint Antoniusziekenhuis
Nieuwegein, The Netherlands
Introduction
The Sint Antonius Hospital is situated in three locations, two in the city of Utrecht and one in the city of Nieuwegein, the Netherlands. The total number of beds is 880.
At the Utrecht locations basic care is provided, as the Nieuwegein location gives high care and specialises in heart-lung surgery and oncology.
The laboratory at one of the Utrecht locations only has a limited functionality for STAT requests. At the other Utrecht location all “basic” tests are performed. The (main) location in Nieuwegein offers a wide range of tests, including special techniques. In 2009 the department of clinical chemistry received 472618 requests representing over 3.000.000 test orders.
My responsibilities at Sint Antonius include the system of IQC, training the staff in Six Sigma, system evaluations and method validations and developing an advanced process control system in accordance with the ISO 15189. The laboratory organisation is accredited since 1998.
Hospital laboratories are urged to perform better with less budget. In general there is always a strong need to keep the expenses as low as possible while maintaining the level of quality of the measurement procedures. We have been able to reduce the costs of failure and at the same time maintain the level of quality by designing our IQC-procedures using TEa and Six Sigma.
Although many laboratory organisations still hesitate to introduce this model for process control, possibly because of lack of knowledge of the underlying theory, we strongly suggest to investigate in these developments since it can reduce the costs of failure. In this report the tolerance (TEa) of the analytical measurement procedures comes from biological variations within and between persons as published in the biological database by Ricos et al. This is valid for most of the basic chemistry procedures. Other sources for the tolerance are available and are described at the Stockholm Conferences on Strategies to Set Global Quality Specifications in 1999.
A new approach to internal QC
In december 2006, with the introduction of a new analyzer at the Nieuwegein location we started using TEa and Six Sigma for the selection of the QC-rules according to the schedule in figure1.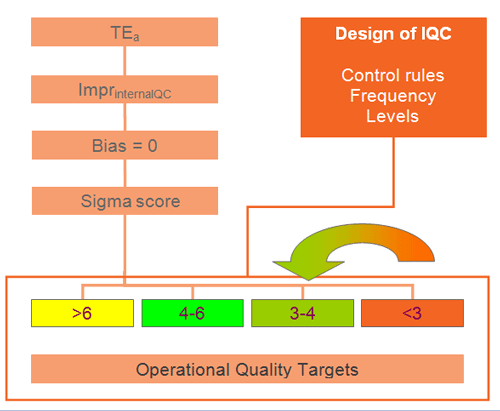
For this purpose we used data collected during the validation of the analyzer to decide which rules to apply (table 1).
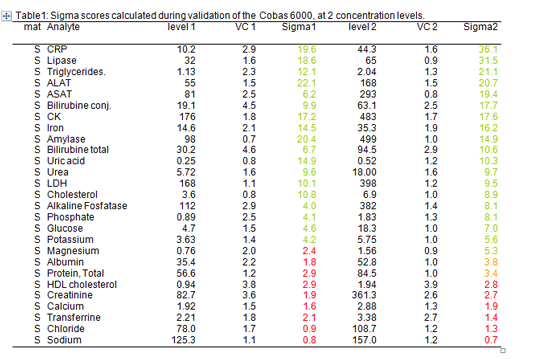
Table 1: Sigma scores calculated during validation at 2 concentration levels.
For practical reasons the Sigma scores are divided in 4 groups for the selection of the QC-rules:
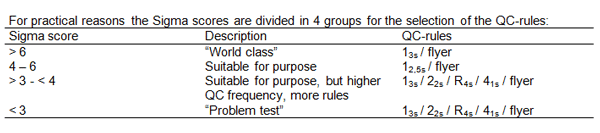
Table 2: Selection of Westgard rules based on Sigma score.
We used the lowest Sigma score of both qc-levels for determining which rules to apply.
The selection of Westgard rules and the frequency of control measurements are presented in table 2. The selected rules give sufficient probability of error detection (Ped), combined with a low probability of false rejection (Pfr).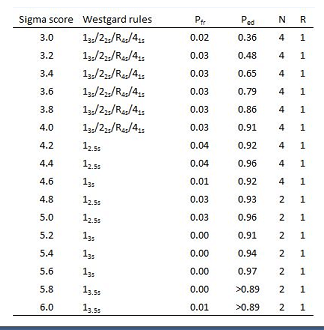
In 2007 the three remaining old analyzers were replaced by the latest generation systems. QC results are on line communicated to the LIMS (Laboratory Information and Management System) and from here to QC-today® (Instrumentation Laboratory), the application used for quality control.
In this program an overview of all qc measured on all analysers at all locations is presented, and it is easy to export IQC-data for statistical evaluation.
Having collected a large amount of IQC results from the analyzers we decided in 2009 to recalculate the Sigma-scores, now based on these (long term) data, and if necessary adjust our control settings, this time using EZ rules3®.
Table 3 shows the calculated Sigma scores and the selected QC-rules.
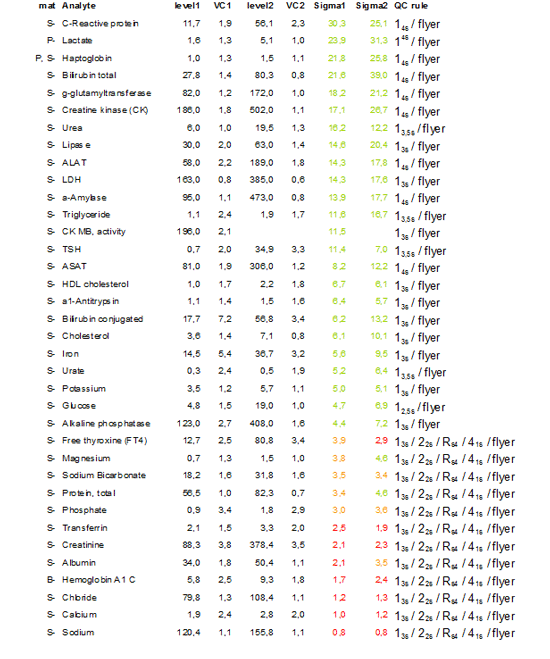
Table 3: Recalculation of Sigma scores for adjustment of qc settings in 2009
The same tests as in 2006 show low Sigma metrics. This is caused by the low TEa in combination with technical limitations of the method used for analysis. For these “problem” tests 2 levels of QC are run 3 times a day (Albumin, Calcium, Creatinine, Sodium, Potassium, Chloride, Total protein and Transferrin), for all other tests 2 levels of qc are run once a day.
The most adjustments were made for those tests with high scores and controlled with a 13S rule, dependent on the Sigma metrics a 13.5S or a 14S rule was defined. This model is still further improved by using TE optimal instead of TE allowable since very high sigma scores are not an argument for the use of very extreme control rules such as 10s or even higher.
The results
As a result of IQC design less stringent IQC rules were applied in many of the analytical test procedures leading to less alarms, strongly reduced number of reruns, calibration runs and technical interventions.
As an example the illustrations below show the difference in the number of alarms caused by a reagent lot number change with a 13s/22s/R4s/41s and Flyer rule (Figure 2) compared to a 13.5s and Flyer rule (Figure 3).
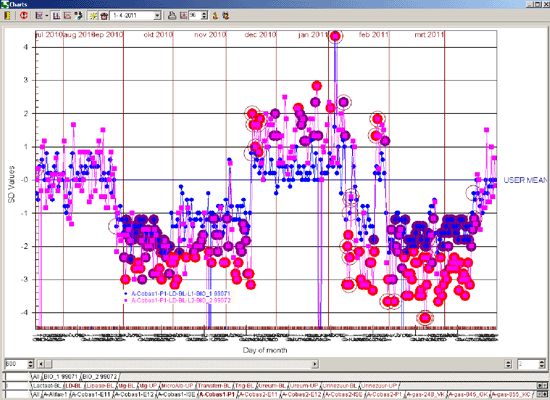
Figure 2
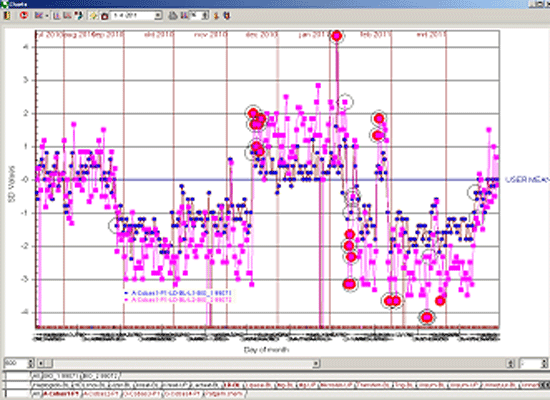
Figure 3
The design of quality control makes live a lot easier for the lab technician saving time solving “problems” not really being a problem. We realised a reduction in the cost of IQC-material, calibrators and reagents, without reporting more or less incorrect results to the clinician.
The reduction in usage of IQC material realised over a period of 4 years at the Nieuwegein location is visible in the number of units (each unit containing 25 bottles of 10 ml.) of a multi-control material for the chemistry ordered on an annual basis, as shown in table 4. These numbers represent one level of IQC material. The numbers for the other level are equal.
| Table 4: Average use of qc-material 2006 – 2010 | ||||
| Year | QTY ordered | Months used | QTY /month | Difference % |
| 2006 | 62 | 29 | 2.2 | - |
| 2008 | 26 | 29 | 0.9 | -59 |
| 2010 | 14 | 26 | 0,54 | -40 |
Difference 2006 - 2010 is 75%
We assumed that the reduction in usage of IQC material was a result of the new designed IQC system and estimated the effect of the new approach. For ALAT, yGT, Triglycerides, Urea and Total bilirubin (IQC control limits 3,5 or 4 SD) we exported the IQC results over the year 2010 from qc-today.
By counting the number of results outside the defined IQC control limits we calculated the percentage of reruns. Then we determined the percentage of reruns if IQC control limits were set at 2 SD.
The results are shown in table 5.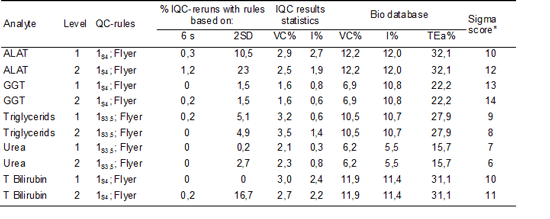
Table 5: Percentages reruns.
Profits
In a period of 4 years we realised a reduction of 75% in the consumption of our multicontrol materials on the analyzers.
This resulted in a saving of € 7550 on an annual basis at the Nieuwegein location. As the number of control measurements at the Utrecht location are about the same the total saving will be € 15100 each year.
Furthermore there is a reduction in consumption of calibrator material and reagents caused by the reduced number of reruns and calibrations and unnecessary replacement of reagent cassettes.
Beside the reduction in “costs of material” we also realised lowered “costs of failures” in terms of avoiding time spent by the technician solving “false” IQC-alarms.
It is less easy to quantify these costs of failure. As an estimate we calculated the effect for five test procedures shown in table 5. The number of avoided reruns was estimated by applying the newly designed IQC versus the convential IQC. The average time the lab technician is occupied rerunning a control, checking the new result and registering the actions performed is estimated at 10 minutes. This can be longer when patient results from the preceding period have to be checked and corrected.
Each rerun means extra reagent consumption, the overall cost per test is estimated at € 2,50. Based on these data we calculate the savings on reagent consumption and labour in table 6.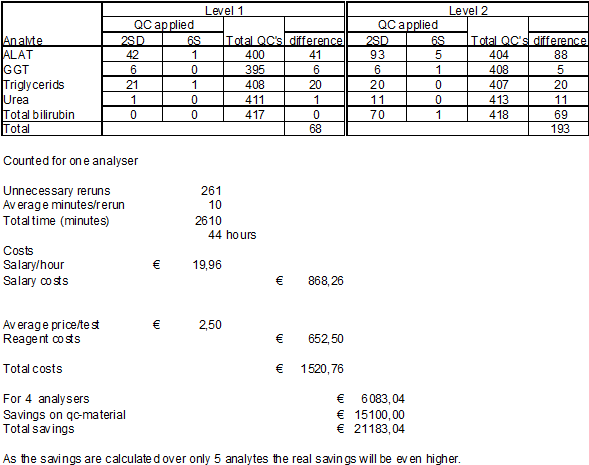
Table 6: Number of reruns with different qc-settings
Practical application
Changing the design of IQC is a process that takes time. The challenge is educating the lab technicians by explaining why some test procedures require stringent multi control rules (the poor performing procedures) whereas some test procedures can be controlled by just a single 4SD control rule.
Another important issue is making clear that each alarm should always be followed by corrective action and that these actions have to be registered.
Conclusion
Introduction of the TEa and Six Sigma approach and the design of IQC asks for an investment in time, setting up the IQC system and mostly for training the laboratory staff how to interprete the results of control measurements.
This investment will be earned back quickly as a result of lower consumption of control materials, calibrators and reagents, and less labour by the lab technician solving “false” alarms.
Credits
A special “Thank you” to Dr. Douwe van Loon, clinical chemist, who guided me into the TEa and Six Sigma approach in designing IQC, and brought me at the level of thinking I am now.
References
http://www.westgard.com
https://westgard.com/biodatabase1.htm (for TEa)
Westgard EZ rules 3®
QC-today (for QC-results)