Quality Standards
Graphic Report of TSH Quality
A landmark report was issued by the IFCC Working Group on Standardization of Thyroid Function Tests. This study compared 16 different immunoassays currently on the market. Rigorous precision and comparison of methods experiments were performed. What do the results say? And what does it mean for manufacturers and laboratories?
In the June 2010 issue of Clinical Chemistry, a series of impressive papers were published. The first of them is
[membership/subscription required], Linda M. Thienpont, Katleen Van Uytfanghe, Graham Beastall, James D. Faix, Tamio Ieiri, W. Greg Miller, Jerald C. Nelson, Catherine Ronin, H. Alec Ross, Jos H. Thijssen, Brigitte Toussaint for the IFCC Working Group on Standardization of Thyroid Function Tests, Clinical Chemistry 2010 v. 56, p. 902-911
"BACKGROUND: Laboratory testing of serum thyroid stimulating hormone (TSH) is an essential tool for the diagnosis and management of various thyroid disorders whose collective prevalence lies between 4% and 8%. However, between-assay discrepancies in TSH results limit the application of clinical practice guidelines...."
This study presents a method comparison study on 16 different immunoassays to assess comparability and performance. It's a landmark accomplishment, to get so many methods in a single study.In every aspect, the study authors attempted to get thorough, robust estimates of variation, bias, and performance.
- A normal range of samples
- A good range of performance behavior
- What precision do these method achieve?
- To what are the methods compared? Against what standard are they judged?
- What are the decision levels of interest?
- So what is the bias?
- What is the quality standard for TSH method performance?
- A Graphic Depiction of Method Acceptability (Sigma-metrics Method Decision Chart)
- A Graphic Depiction of QC Design (OPSpecs Chart)
- What if we don't believe in bias? (Sigma-capability)
Let's start with the data.
A normal range of samples
The study started by screening 200 apparantly healthy candidates for a selection of 40 single-donor sera samples that represented a expected range of values for the normal reference range.
A good range of performance behavior
Not only did the study try to account for a range of test values, it also tried to account for the range of instrument behavior.
"The study protocol required duplicate measurements in 3 runs with preferably 3 different combinations of instruments/calibrator and reagent lots (see Table 2 for manufacturer conformance to intended design), controlled with manufacturers’ internal quality control (IQC) materials."
This means that there is a better picture of overall method performance. Usually, studies have only one instrument, one reagent lot, one calibration, so the results may only be a lucky snapshot. By looking over changes between reagents and calibrations, and looking at multiple instruments, you get a broader view of instrument performance.
What precision do these methods achieve?
The study used the same patient samples to calculate the imprecision of the methods:
"We assessed imprecision from the results for the human samples as the within-run CV (CVw) (calculated from the duplicates and pooled for the 3 runs) and total CV (CVt) (calculated from the first and second replicate of each run and pooled)."
Here is the listing of Total Imprecison (CVt) for the methods:
| Assay Code | Total Imprecision (CVt) |
| A | 3.5% |
| B | 5.2% |
| C | 2.5% |
| E | 4.9% |
| F | 5.9% |
| G | 5.5% |
| H | 3.3% |
| I | 4.8% |
| J | 2.9% |
| K | 4.2% |
| L | 5.3% |
| M | 3.3% |
| N | 3.6% |
| O | 6.5% |
| P | 2.7% |
| R | 7.7% |
To what are these methods compared? Against what is the bias measured?
Having the right samples and the right methods isn't quite enough. There needs to be a good protocol, particularly for a comparison study with so many methods.
Given that the TSH method lacks a recognized reference method, the authors had to use an all-method mean. But rather than use the typical all-method mean (any EQA or PT study has those), the authors devised a rigorous type of study that would give a robust mean:
"We investigated the status of harmonization of TSH measurements by use of weighted Deming regression analysis of each assay’s mean of 6 singlicate results per sample to the overall mean (for the reduced concentration range, after exclusion of the 2 lowest and 2 highest values)....
"Each assay produced 6 sets of singlicate results (duplicate measurements in each of 3 runs). We performed third-order correlation analysis separately for each set of singlicate measurements. The individual r2 values were averaged and used to rank the assays according to descending correlation as a measure of scatter in results. For each assay, we identified 1 set of the 6 singlicate results as being the most representative, when its r2 value was closest to the mean r2 for that particular assay.We estimated the influence of the variation due to assay imprecision and sample-related effects (combined random error components) by use of a difference plot in concentration units of the most representative, recalibrated (same procedure used as described above) set of singlicate results. The differences were interpreted against total error limits, as derived from the biological variation concept (total error goal within 22.8%, derived from a desirable bias within 6.9% and a desirable imprecision <9.7%) (9 )."
This is a novel approach, one that attempts to get the best "all method" mean. We understand that a future paper will be published giving more details on how to use this type of approach on other test methods. Given that so many tests still lack a reference method, this technique is sorely needed.
In summary, here is a selection from Table 1, "Weighted Deming regression parameters, representing the relationship between each assay's mean of 6 singlicate results and the overall mean (for the reduced concentration range)....
| Assay Code | Slope | Intercept, mIU/L |
| A | 1.105 | -0.006 |
| B | 1.02 | -0.020 |
| C | 1.134 | 0.029 |
| E | 1.067 | -0.055 |
| F | 1.038 | 0.045 |
| G | 0.828 | 0.003 |
| H | 0.971 | 0.017 |
| I | 0.974 | -0.002 |
| J | 1.001 | 0.054 |
| K | 0.811 | 0.040 |
| L | 0.940 | -0.008 |
| M | 1.133 | -0.090 |
| N | 0.975 | -0.010 |
| O | 1.057 | -0.081 |
| P | 1.049 | -0.014 |
| R | 0.906 | 0.077 |
Remember, the ideal slope is 1.00 and the ideal y-intercept is 0. Differences from that ideal indicate there is the presence of proportional and/or constant systematic error, respectively. By themselves, the slopes and intercepts are hard to judge. A few methods clearly have some troubles, but most of them are reasonably around 1.00.
What are the decision levels of interest?
The study notes that a conventional TSH reference range covers 0.4 to 4 mIU/L. Those two values provide us with two decision levels where interpretation is important. Below 0.4 mIU/L, TSH is considered suppressed. Above 4 mIU/L, TSH is considered increased.
So what is the bias?
Using the regression equations above, you can calculate the bias at each of these two decision levels
| Assay Code | Slope | Intercept, mIU/L | Bias at 0.4 mIU/L | Bias at 4.0 mIU/L |
| A | 1.105 | -0.006 | 9.00% | 10.35% |
| B | 1.02 | -0.020 | 3.00% | 1.50% |
| C | 1.134 | 0.029 | 20.65% | 14.13% |
| E | 1.067 | -0.055 | 7.05% | 5.33% |
| F | 1.038 | 0.045 | 15.05% | 4.93% |
| G | 0.828 | 0.003 | 13.95% | 16.88% |
| H | 0.971 | 0.017 | 1.35% | 2.48% |
| I | 0.974 | -0.002 | 3.10% | 2.65% |
| J | 1.001 | 0.054 | 13.60% | 1.45% |
| K | 0.811 | 0.040 | 8.90% | 17.90% |
| L | 0.940 | -0.008 | 8.00% | 6.20% |
| M | 1.133 | -0.090 | 9.20% | 11.05% |
| N | 0.975 | -0.010 | 5.00% | 2.75% |
| O | 1.057 | -0.081 | 14.55% | 3.67% |
| P | 1.049 | -0.014 | 1.40% | 4.55% |
| R | 0.906 | 0.077 | 9.85% | 7.48% |
With these calculations, we can begin to see larger differences between the methods. Some have bias% in the single figures, some have bias in double-digits.
How much bias is allowable, anyway? For that, we need to select a quality requirement
What's the quality standard for judging TSH method performance?
As mentioned earlier, the authors adopted the Biologic Variation approach, using the figure of 22.8% for allowable total error, taken from Carmen Ricos et al. and their Table of Desirable Specifications with for total error, imprecision, and bias, derived from intra- and inter-individual biologic variation.
This gives a total error goal within 22.8%, derived from a desirable bias < 6.9% and a desirable imprecision <9.7%. Immediately, we can start looking back at those tables and identifying some problematic methods.
But there's an easier way: use Sigma-metric Method Decision chart. This is a graphic way of plotting imprecision and inaccuracy against a quality requirement specification, with a further differentiation of performance using the Six Sigma scale. (For more details on theory and construction of these tools, follow the links).
A Graphic Depiction of Method Performance
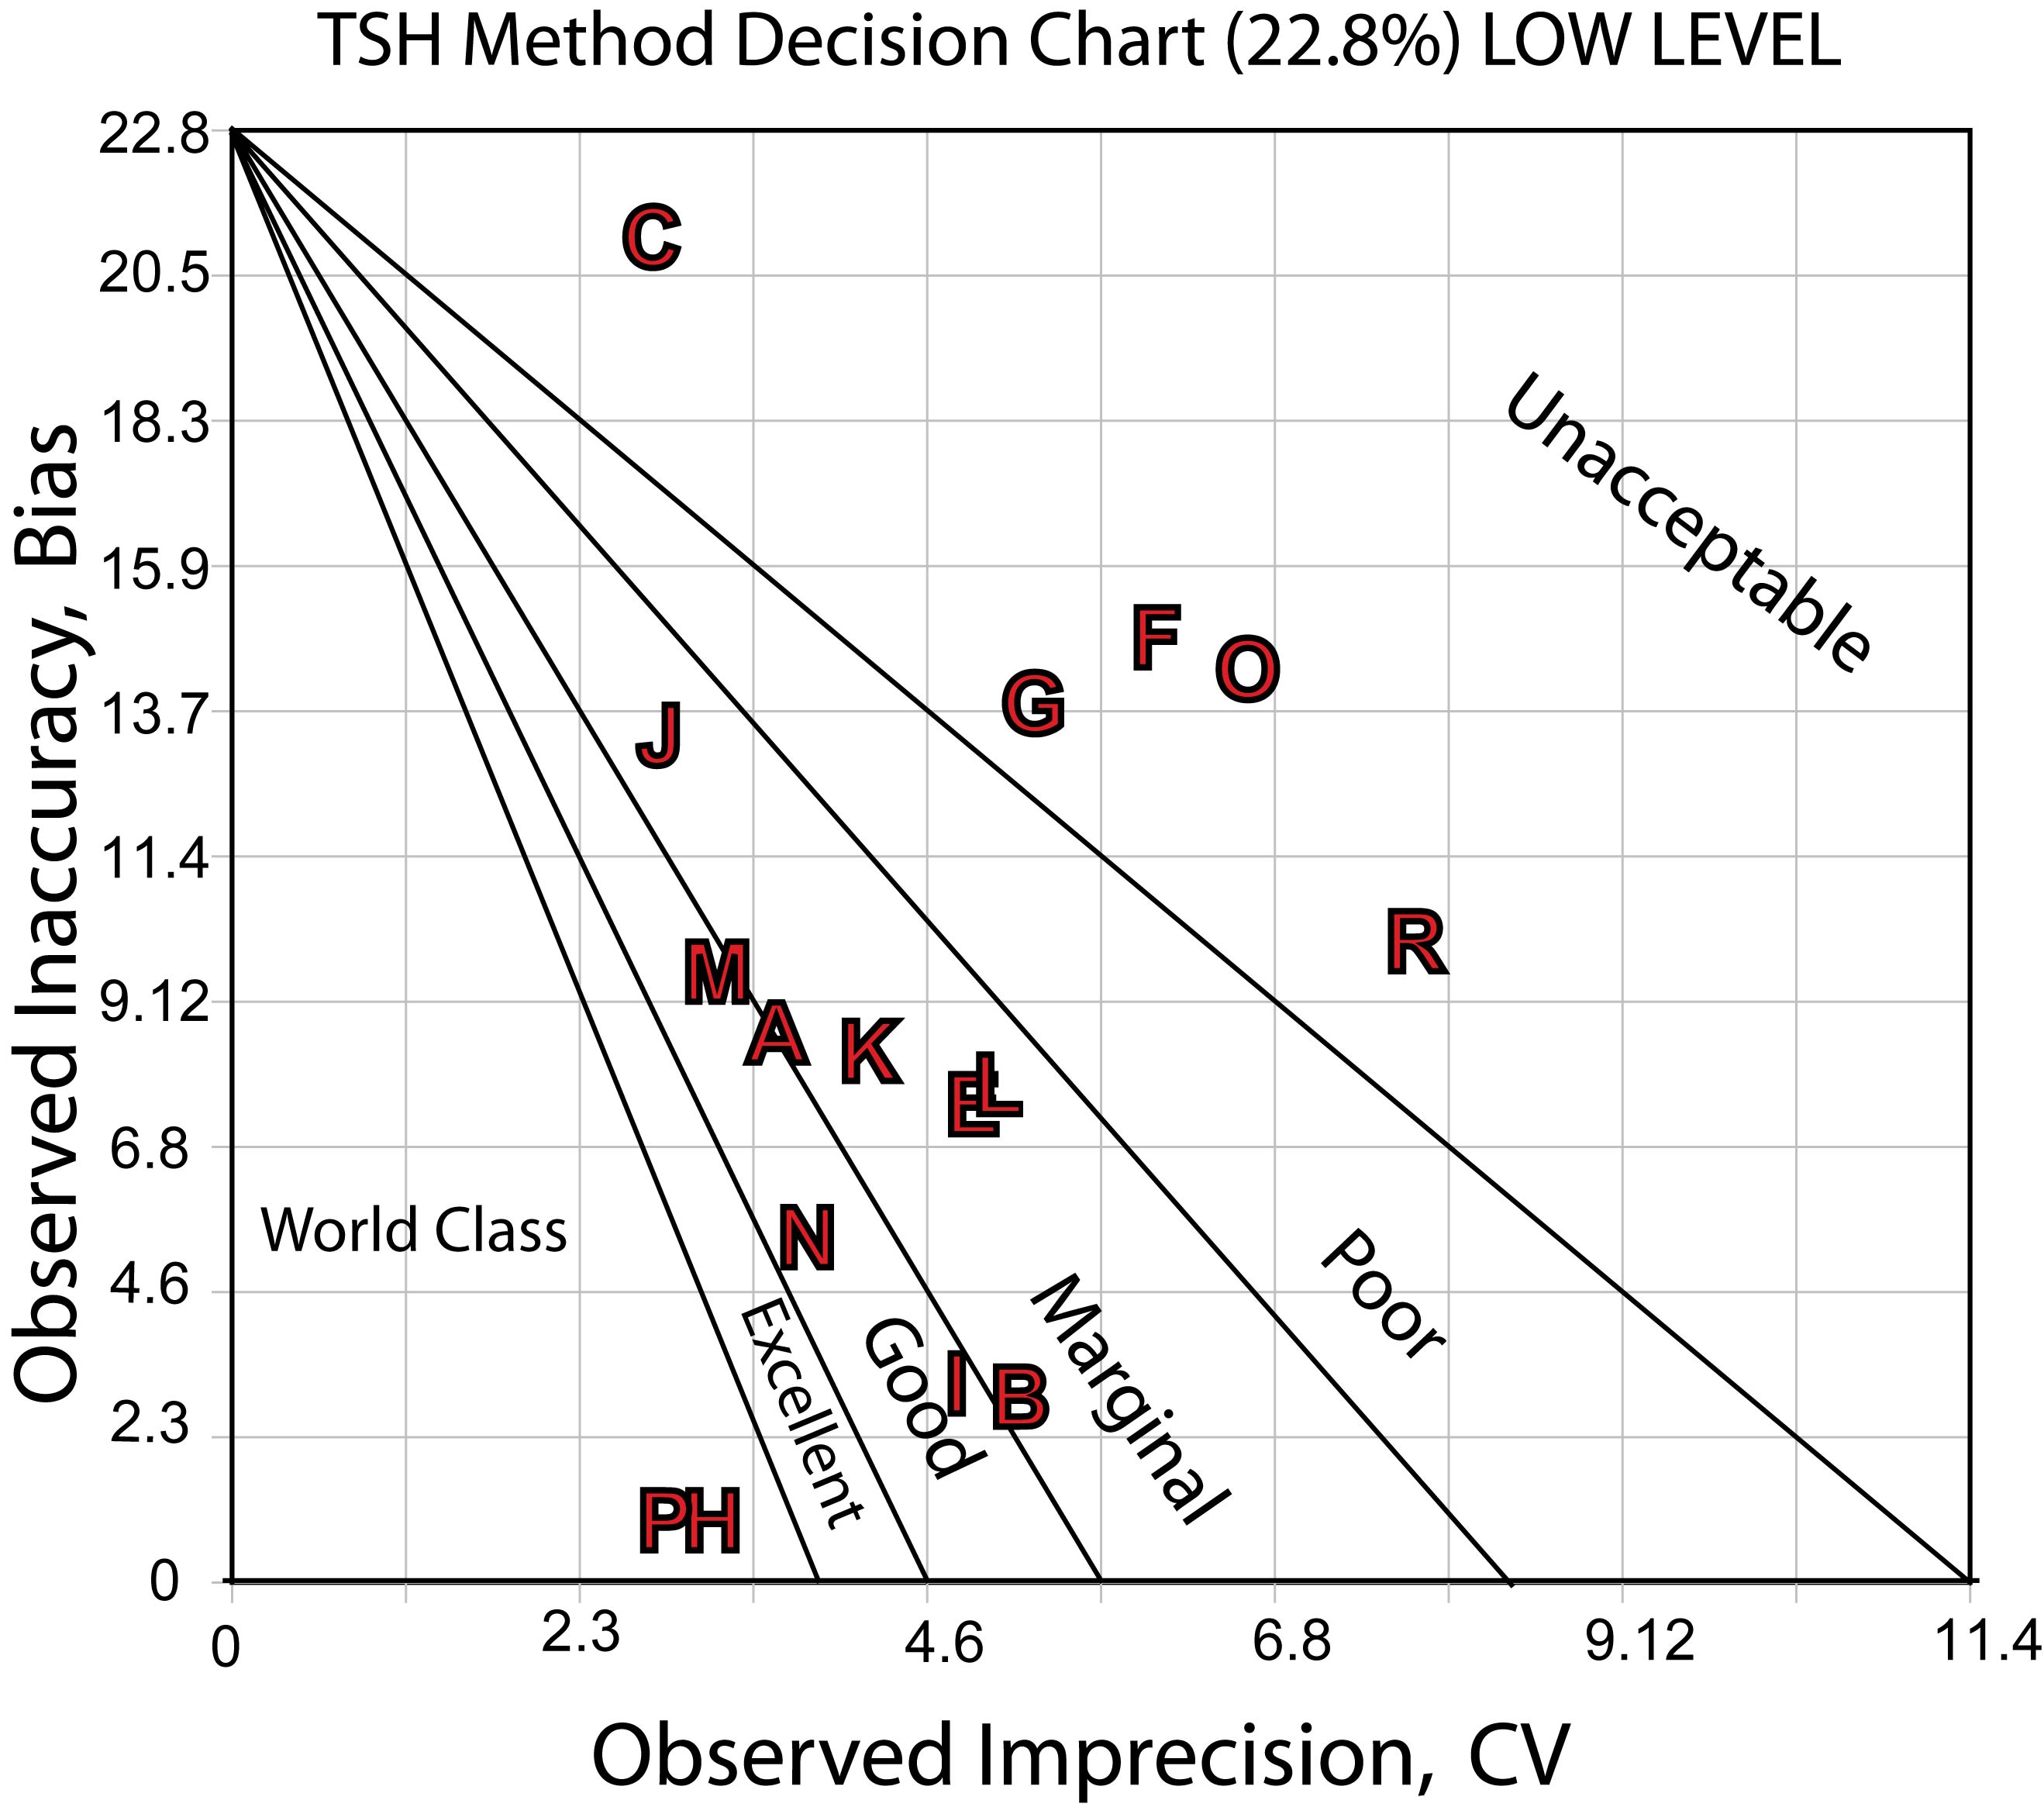
Here's a Sigma-metric Decision Chart for the low decision level: 0.4 mIU/L
Here's the Sigma-metric Method Decision Chart for the high decision level,4.0 mIU/L:
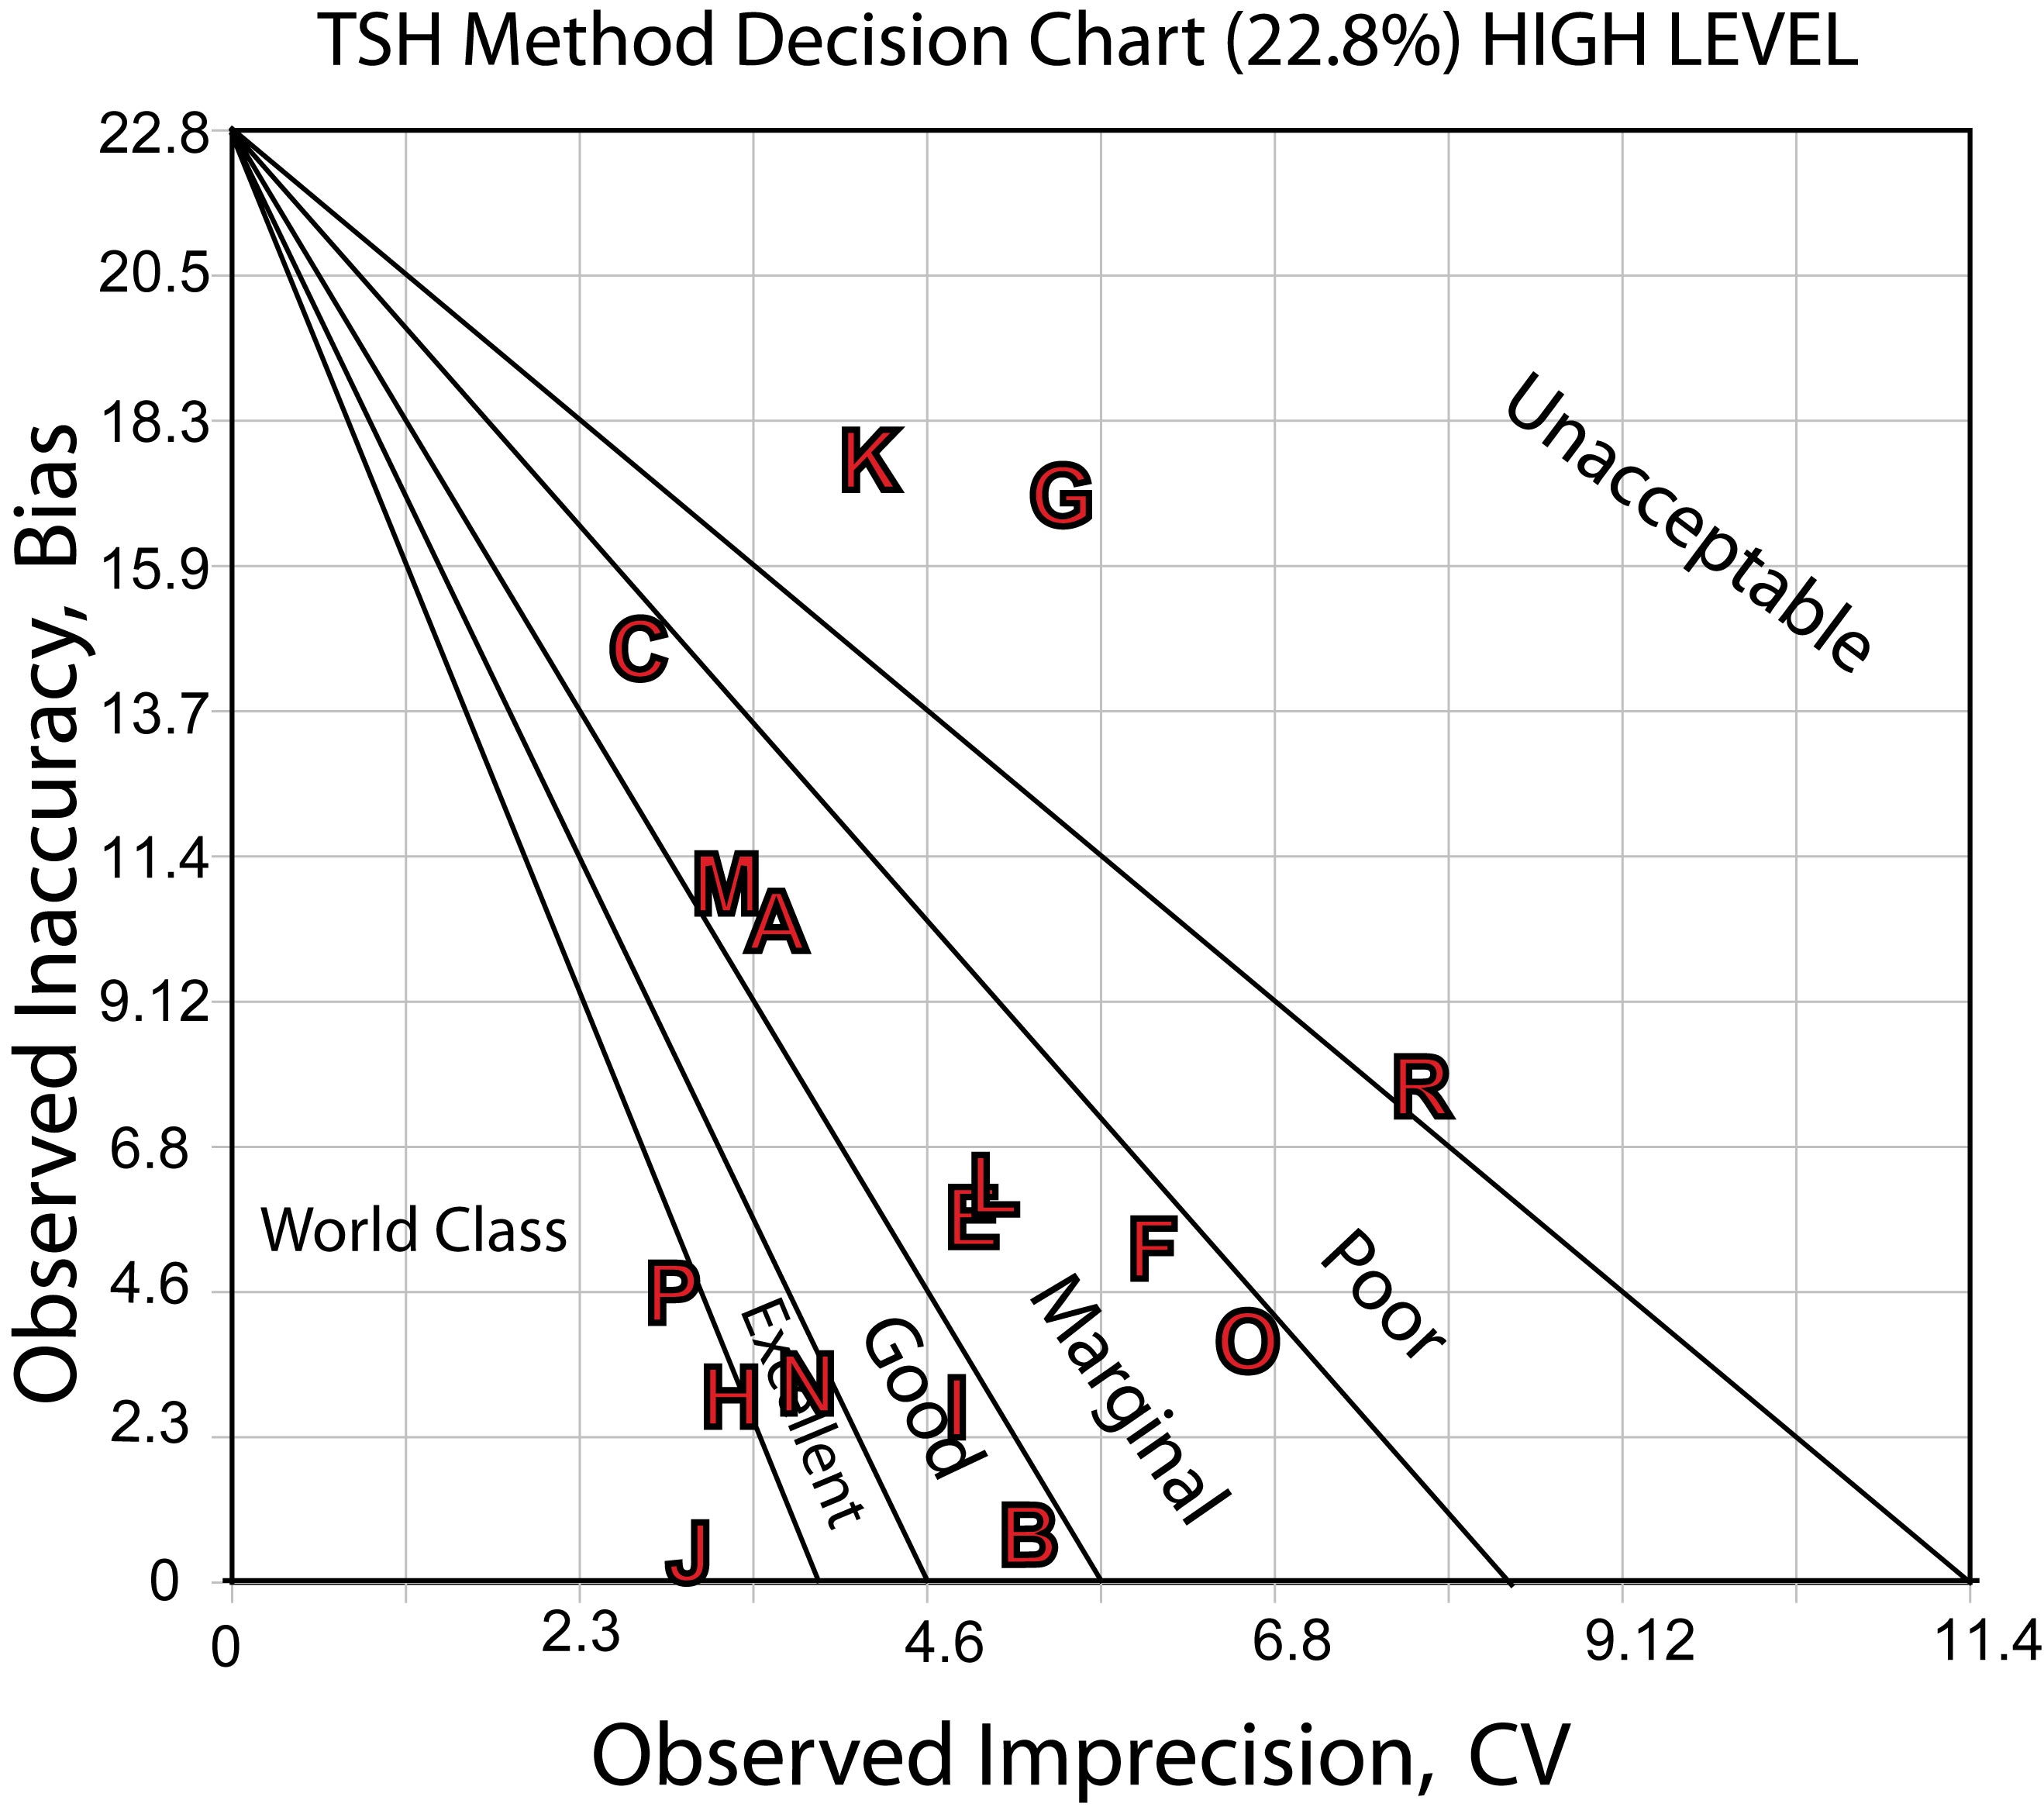
The charts show the differences in performance quite clearly. There are a number of methods that are good to marginally acceptable, a few more that are good or better, with a very few world class methods. On the bad end, there are a few methods that have poor or worse performance.
What does this performance mean for QC and daily operation?
A Graphic Depiction of QC Design
While the Decision charts might provide a way to differentiate methods, there is another question of what QC would be necessary for these methods, if they were to be implemented in a laboratory.
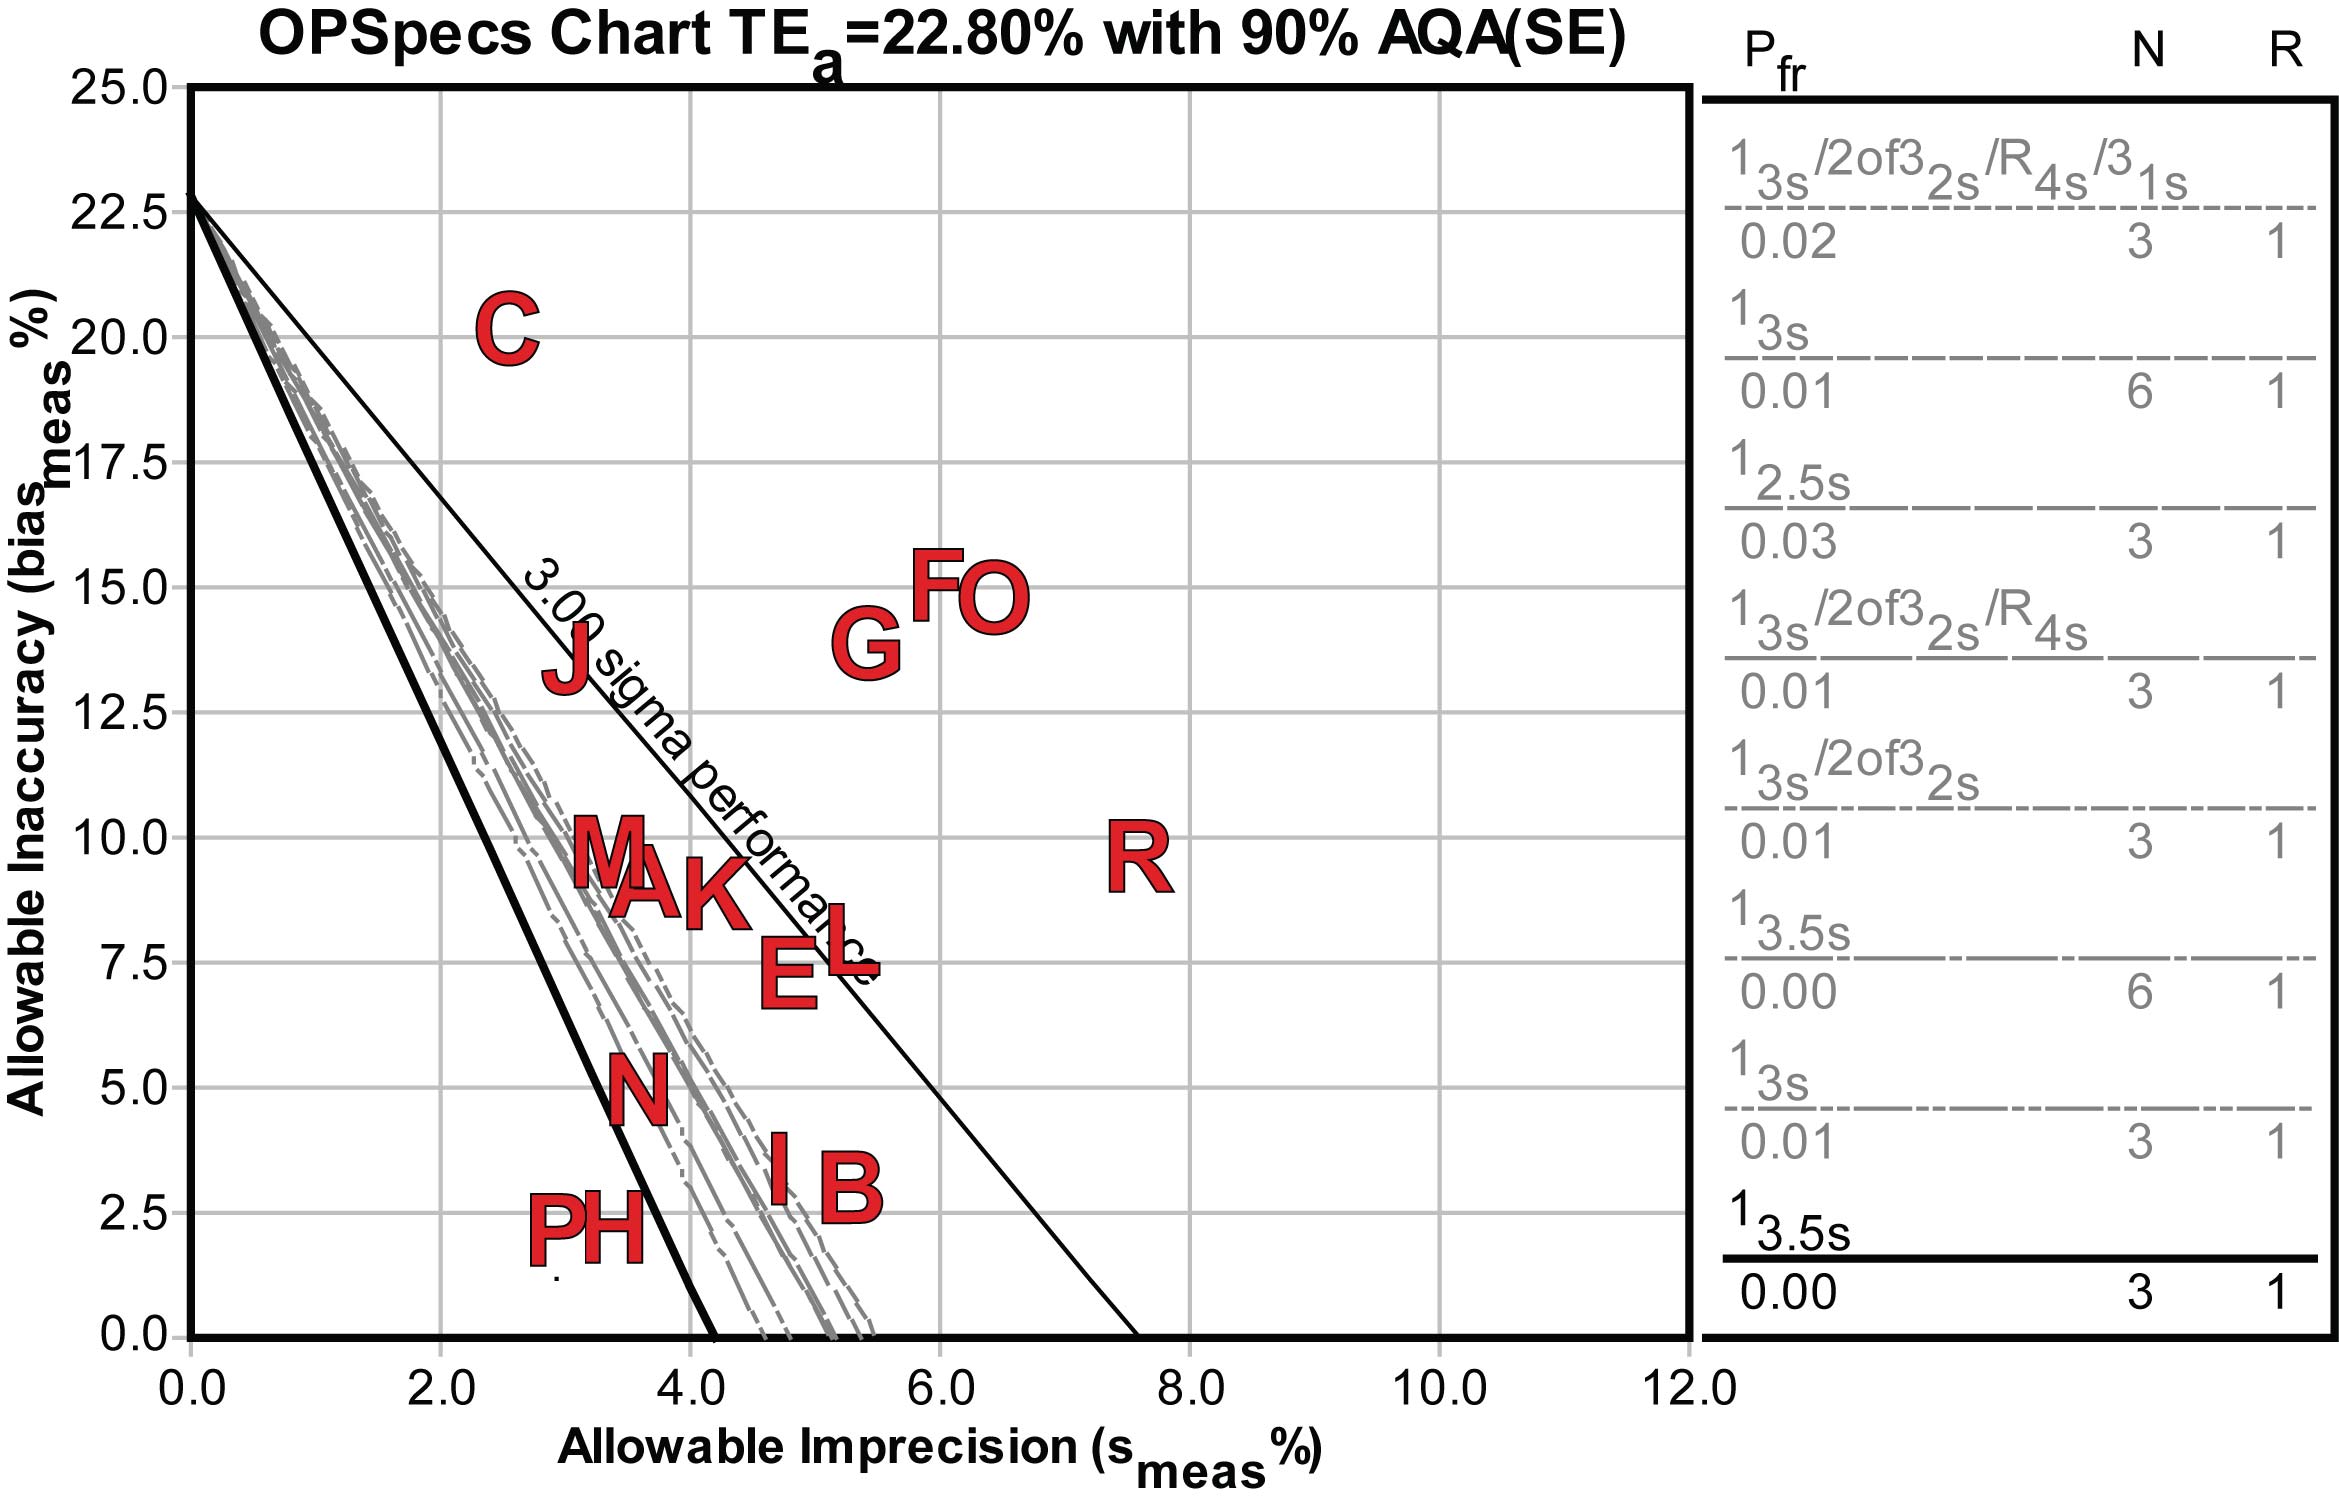
Using an OPSpecs chart, we can determine the control rules and numbers of control measurements to achieve the quality requirement.
Here's the OPSpecs chart for the low decision level, 0.4 mIU/L:
Here's the OPSpecs chart for the high decision level, 4.0 mIU/L:
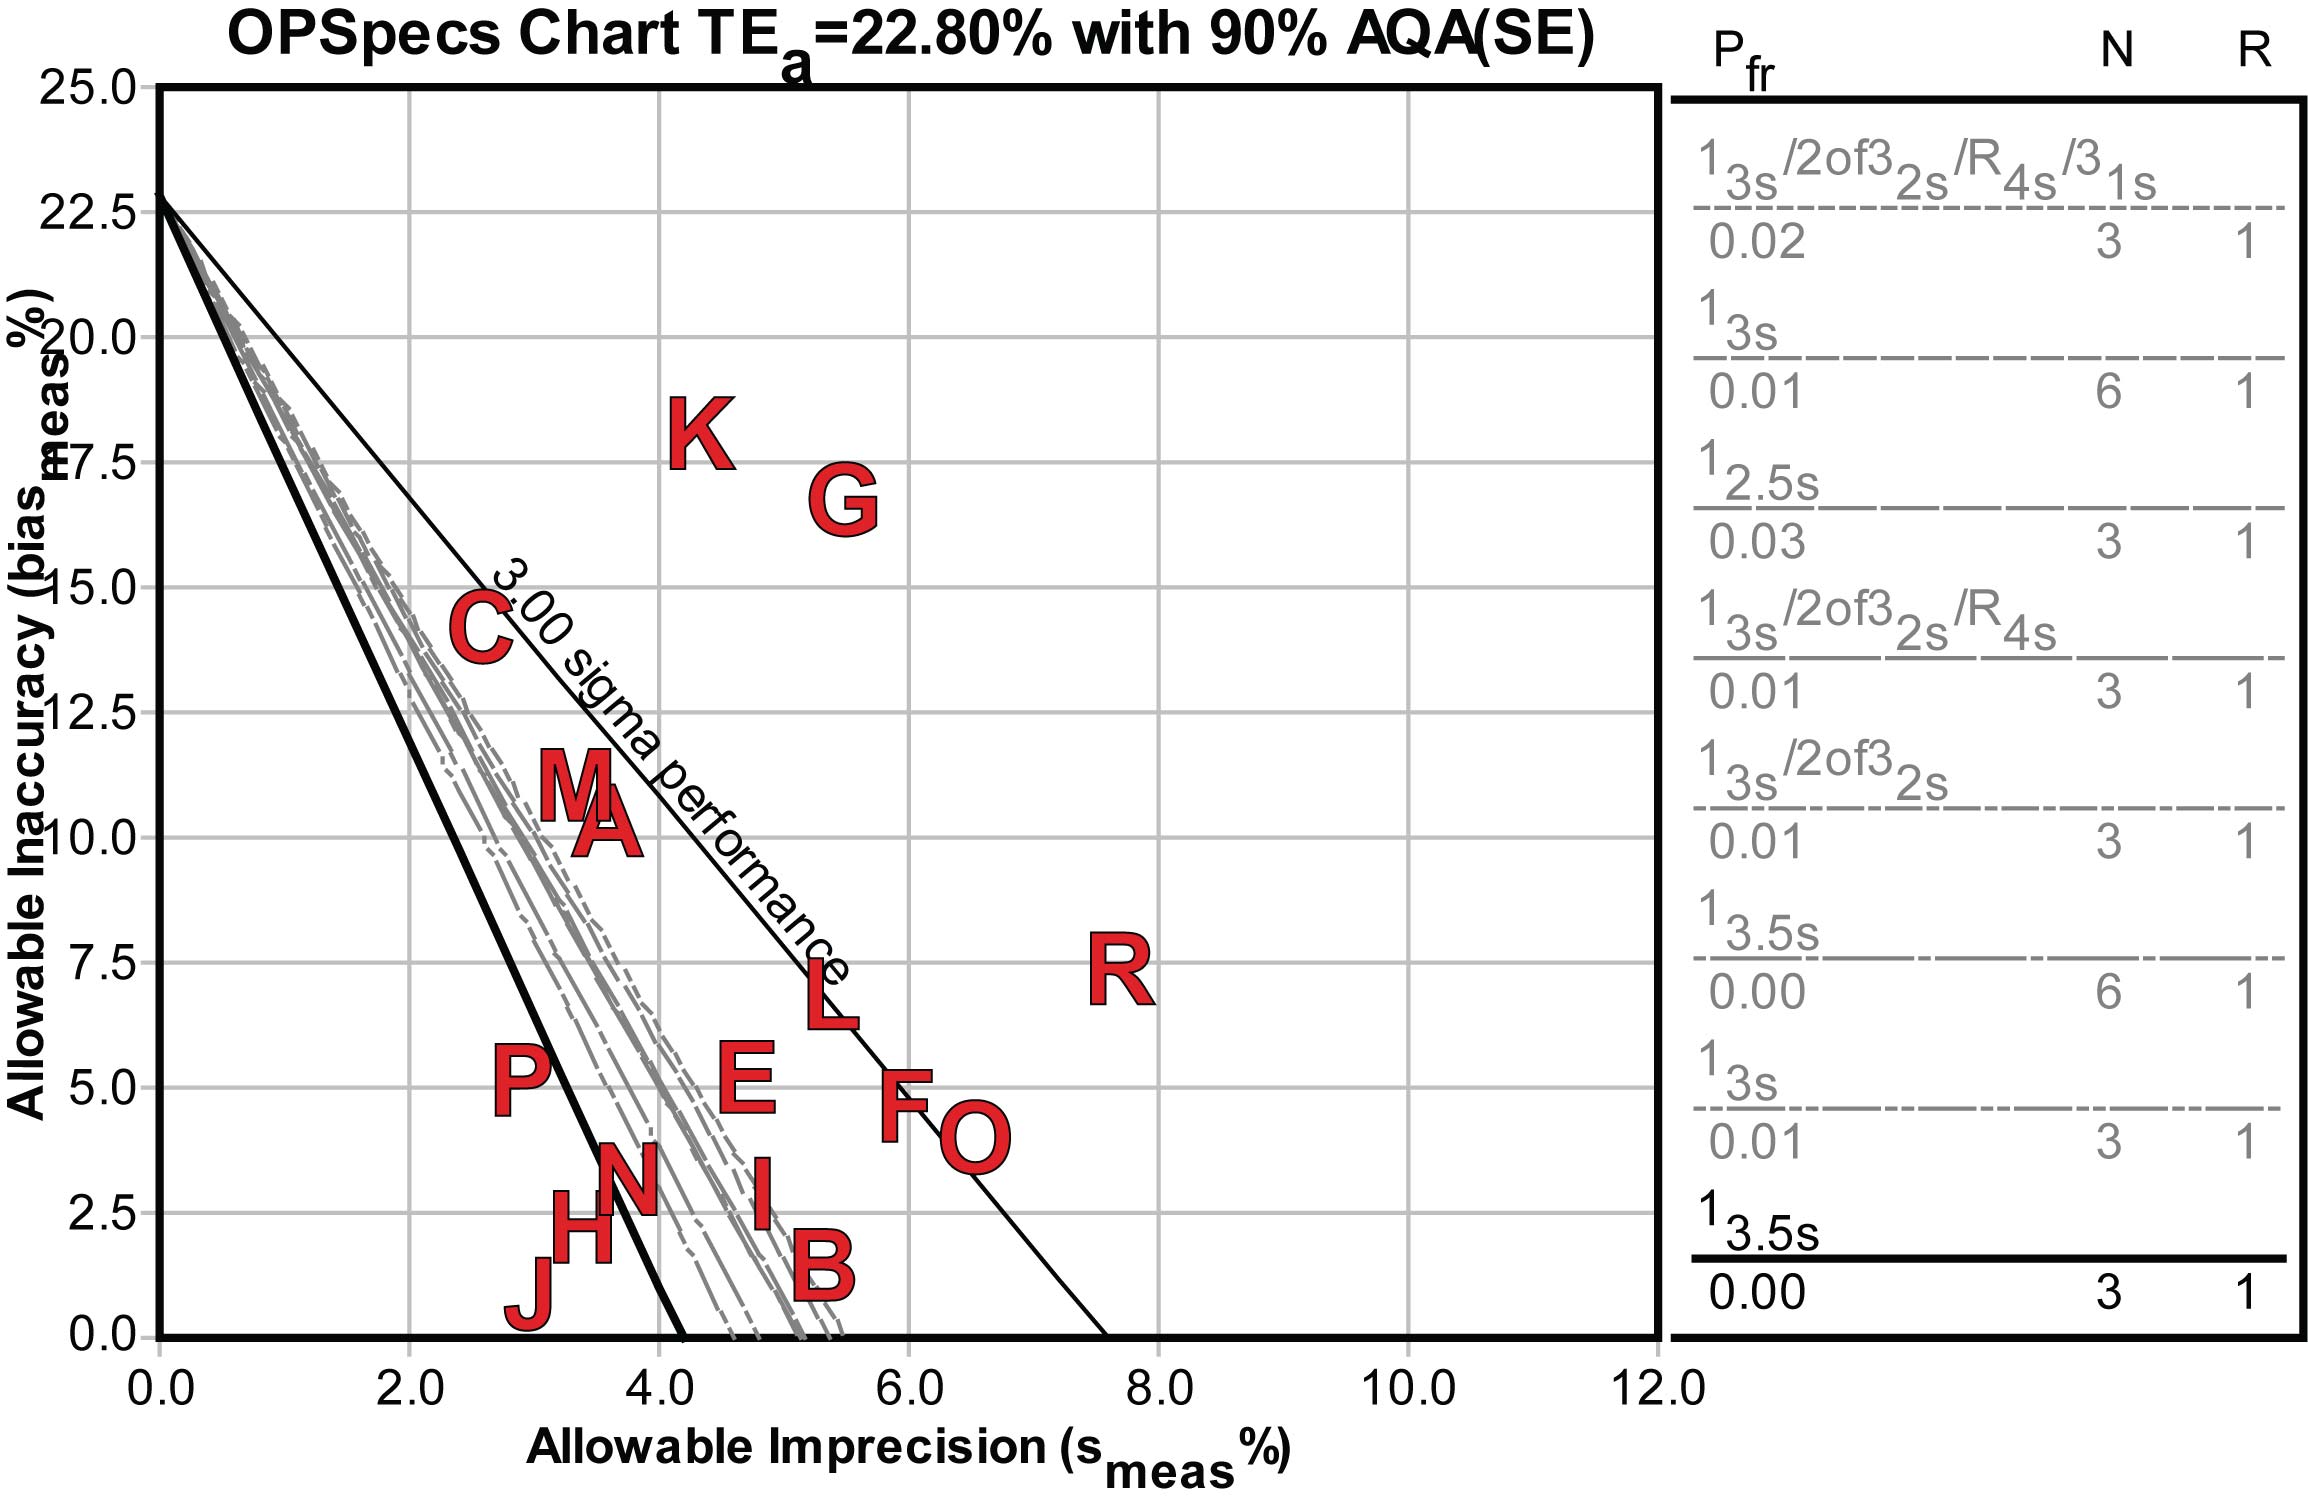
For the handful of good and world class methods, only single rule QC procedures would be required. For others, more investment in QC effort would be required, either doubling the controls or the measurements on the controls may be necessary, as well as more complex multirule QC procedures.
The conclusion
The authors noted a number of methods that needed improvement, but the main aim of the study was to point toward a practical way to harmonize disparate methods. While the study finds most methods acceptable in performance it notes that actual performance may be less ideal.
The graphic tools (Decision Charts and OPSpecs Charts) can add to the method evaluation process. These visual descriptions of performance allow quick assessment of performance as well as assessment of the operational effort required to put them into routine use. From a quality control point of view, the OPSpecs charts tell us that some of these acceptable methods would actually require extensive effort in order to detect the smallest critical difference.
Update: What if we don't believe in (this) bias?
Our colleague Dietmar Stockl points out that since the bias of this study is a kind of "middle of the pack" mean, it may not be the most useful calculation for Sigma-metrics. It's useful for manufacturers, but probably not for labs. This kind of bias is a relative determination at best - it might be better to try and peg the method against something more authoritative or relevant to your local laboratory.
In a case where you don't want to use the bias calculations, you can simply eliminate the bias component from the Sigma-metric calculation. (Of course, bear in mind that you are only determining the Sigma-capability of your method. In other words, you can get an idea of what you could potentially achieve if you had no bias in the method. But until you've determined how much bias there is in your method, the Sigma-capability metric is just an optimistic estimate.)
Given a 22.8%, quality requirement, You need at least a 3.8% CV to achieve 6 Sigma, a 4.56% CV to achieve 5 Sigma, a 5.7% CV to achieve 4 Sigma, and a 7.6% CV to achieve 3 Sigma. These thresholds are drawn on the chart below as vertical lines. The Method CV's are displayed as horizontal bars starting from left and extending to the right; the longer the bar, the higher the CV.
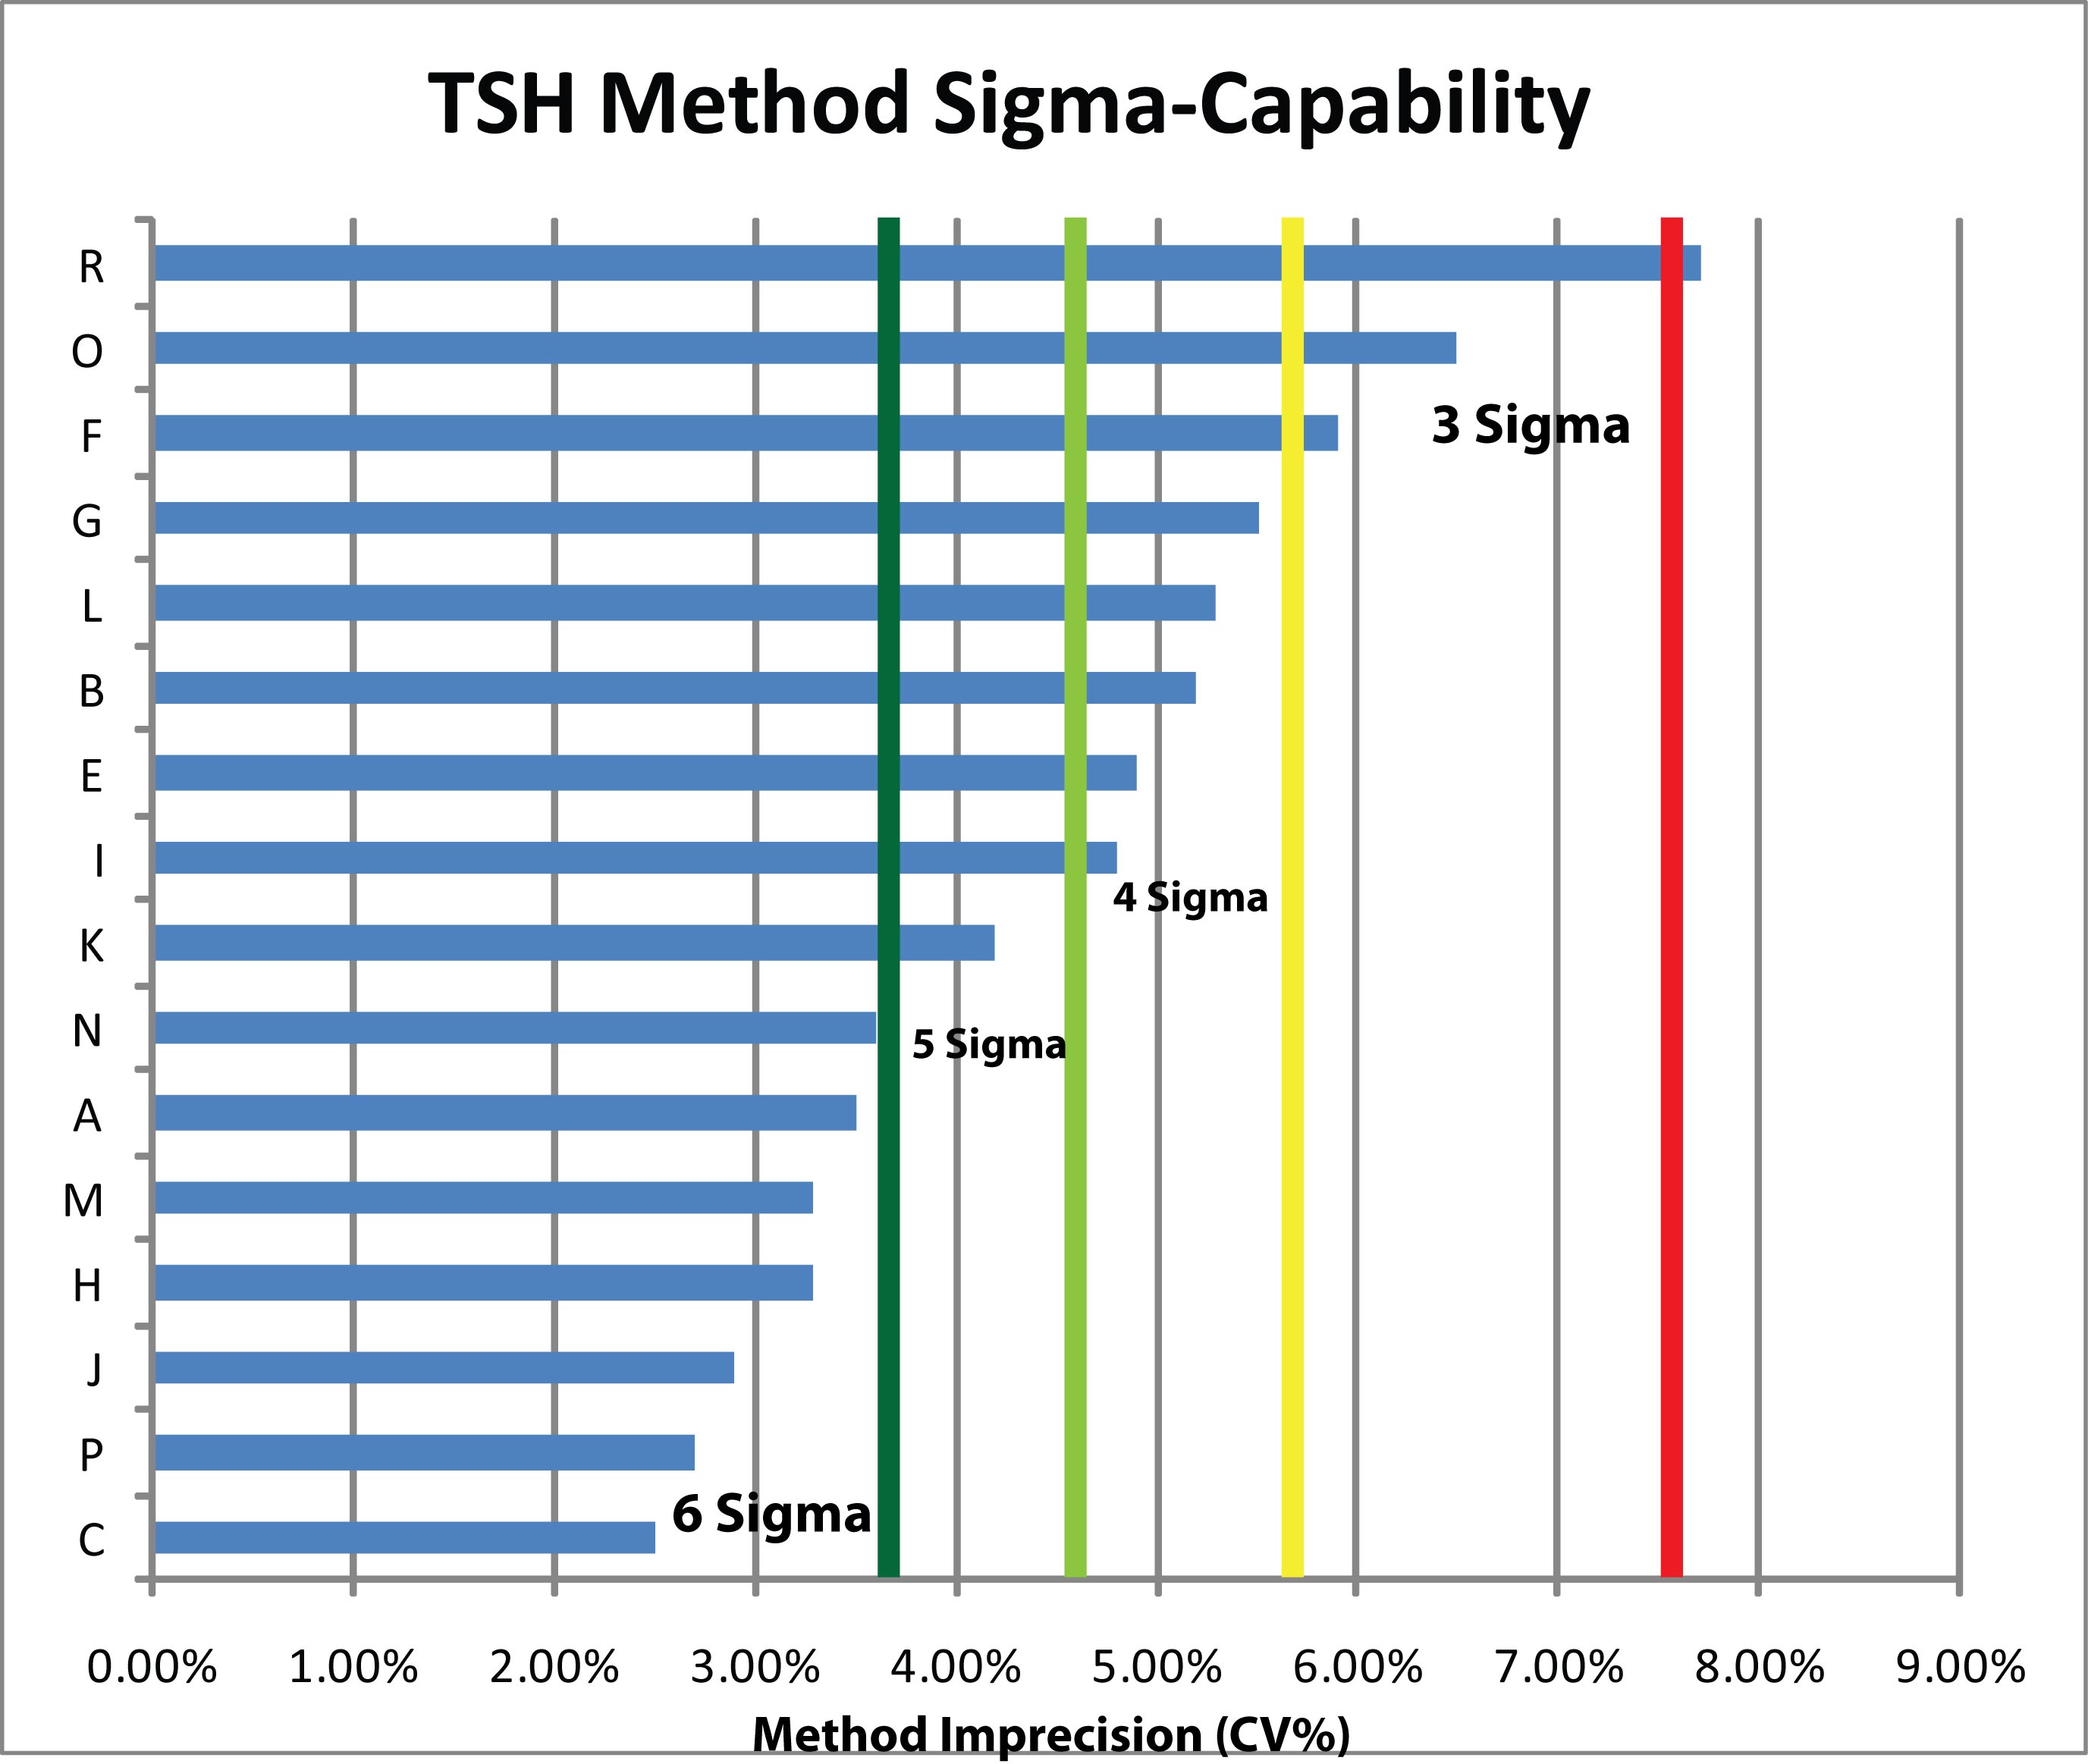
The study results, viewed in this light, show that nearly every method is at least capable of the minimum acceptable performance (3 Sigma). More than half a dozen of the methods are beyond the (dark green) Six Sigma capability threshold. A good number of methods, in other words, can achieve Six Sigma quality.
