Quality Management
Critical-Error Graphs
James O. Westgard, Ph.D.
Want to know just how much your error detection is? What precisely your false rejection is? For all the methods in your laboratory? Critical-Error graphs are powerful tools that tell you quickly how well your method is performing.
- What is a critical-error graph?
- How do you calculate the size of medically important errors?
- Cholesterol example calculations
- How do you use a critical error graph to estimate the probability of error detection?
- What are the general guidelines for QC selection?
- How do you develop specific QC recommendations?
- References
What's a critical error graph ?
A critical-error graph is simply a power function graph that also displays the size of error that is medically important and needs to be detected by the QC procedure. Remember that a power function graph shows the probability of rejecting a run on the y-axis versus the size of error on the x-axis. Like power function graphs, critical-error graphs can be prepared for both systematic and random errors. [If you are not familiar with power function graphs, please review the earlier lesson on Power function graphs.]
How do you calculate the sizes of medically important errors?
The critical-sizes of the systematic and random errors that need to be detected by the QC procedure can be calculated from the quality requirement and the observed imprecision and inaccuracy by the following equations:
 SEcrit = [(TEa - biasmeas)/smeas] - z
REcrit = (TEa - biasmeas)/zsmeas
where TEa is a quality requirement in the form of an allowable total error, biasmeas is the observed inaccuracy of the method (and is considered as an absolute value in these calculations), smeas is the observed imprecision of the method, and z defines the tail of the distribution that is allowed to exceed the quality requirement and is often chosen as 1.65 to set a maximum defect rate of 0.05 or 5%. These equations are derived from an analytical quality- planning model [1]; similar equations can be derived from the clinical model [2], but they are more complicated due to the additional preanalytical factors that must be included.
Cholesterol example calculation
If TEa is 10%, smeas is 2%, and biasmeas is 2%,
then the critical systematic error is
((10-2)/2) -1.65 = 2.35
This means that a systematic shift equivalent to 2.35 times the CV of the method (i.e., a systematic change of 4.7%) needs to be detected by the QC procedure.
The critical random error is
(10-2)/(1.65*2) = 2.42
For random error, a 2.42-fold increase in the CV (i.e., an increase to 4.8%) needs to be detected by the QC procedure.
How do you use a critical-error graph to estimate the probabilities of rejection?]
As with a power function graph, the probability of false rejection (Pfr) is determined from the y-intercept of the power curve. Remember that stable method performance is represented by the values of 0.0 on the SE graph and and 1.0 on the RE graph. Thus, the y-intercept describes the probability for false rejection (Pfr) when a method is working properly. The probability of error detection (Ped) is determined by drawing a vertical line that corresponds to the value of the critical-sized error, then reading the probabilities at the points of intersection with the power curves.
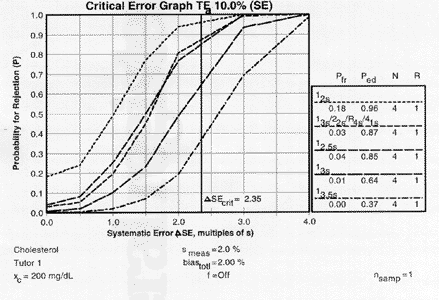 |
| Critical-error graph for detection of SE ( SEcrit=2.35) by commonly used control rules with N=4. Note that the order of lines in the graph match the order of lines in the key at right. Thus, the top line in the graph matches the top line in the key - a 12s rule with N of 4. |
For our cholesterol example, the value of 2.35 is located on the x-axis, a vertical line drawn to intersect the power curves, then the points of intersection are read off the y-axis to estimate Ped, as shown in the accompanying figure.
The probabilities for error detection are seen to vary from 0.37 to 0.87 for the 13.5s, 13s, 12.5s, and multi-rule procedures when N is 4. Given the general objective of achieving 0.90 or 90% error detection, the 12.5s single-rule and the 13s/22s/R4s/41s multi-rule combination provide close to ideal error detection. The probabilities for false rejection are read from the y- intercepts, which vary from 0.00 to 0.04, or 0 to 4%. Given the objective of keeping the false rejection rate at 5% or less, any of these control procedures are satisfactory for minimizing waste.A similar critical-error graph can be prepared for detection of random error, as shown by the accompanying figure.
 |
|
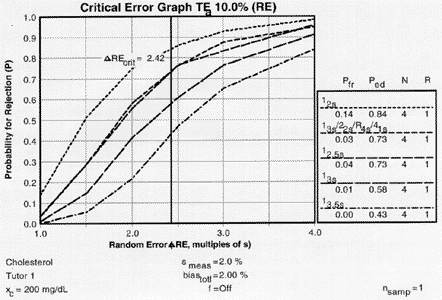
Critical-error graph for detection of RE ( |
Error detection varies from 0.43 to 0.73, which is somewhat lower than observed for the critical systematic error, illustrating that it is generally more difficult to detect the critical changes in random error.
What are the general guidelines for QC selection?
With knowledge of these expected performance characteristics of QC procedures, as described by power function graphs, here are some general guidelines for the application of QC procedures in healthcare laboratories.
- The 12s rule should be limited in general practice to avoid wasting analytical production. With a minimum N of 2, as required by US regulations, laboratories using 2s control limits would be expected to waste nearly 10% of their production. With Ns of 3 and 4, the level of waste increases to 15% to 20%.
- The 13s rule minimizes waste, but may not provide adequate error detection. Laboratories should determine the sizes of errors that need to be detected in order to validate that the sensitivity of the 13s rule is adequate.
- Multi-rule QC procedures with Ns of 2 to 4 provide a good balance for keeping the number of falsely rejected runs low while maintaining good error detection.
- The 12.5s rule gives similar performance to multirule procedures when N is 2 to 4 and may be easier to implement than multirule procedures.
- In cases where it is difficult to achieve the desired error detection within a single run, multi-rule procedures can be used to accumulate control data over more than one run, thereby increasing the detection of errors that persist from run to run.
How do you develop specific QC recommendations?
Specific recommendations for control rules and Ns can be developed using the step-by-step QC planning process that we have described elsewhere on this website. Either critical-error graphs and/or OPSpecs charts can be used for quantitative QC planning. Both of these tools depend on the information available from power function graphs, but they interpolate the power curve from different directions. With a critical-error graph, a quality planing model is used to determine the error condition of interest on the x-axis, then the power curve interpolated to determine the y-value or probability of detecting that error condition. With an OPSpecs chart, a desired error detection is established on the y-axis, then the power curve interpolated to determine the size error that needs to be incorporated in the quality planning model.
From an error-budget perspective [3], the use of critical-error graphs accounts first for the current expenditures for imprecision and inaccuracy, then attempts to fit quality control into what's left in the budget. The consequence is that the margin of safety may not be adequate if the budget has already been used up by the imprecision and inaccuracy of the method, thus you may be unhappy with the control rules and number of control measurements needed to adequately monitor the testing process. OPSpecs charts, on the other hand, establish the QC margin of safety first and then show the imprecision and inaccuracy that are allowable to maintain this margin. With this approach, you may be unhappy when you see the precision and accuracy needed by your method. Both approaches are valid, but many analysts initially find it easier to understand critical-error graphs because of their close relationship to power function graphs.
We'll discuss OPSpecs charts in more detail in the next lesson.
View FAQ's about Power Function Graphs and Critical-Error Graphs
References
- Westgard JO, Hytoft Petersen P, Wiebe DA. Laboratory process specifications for assuring quality in the U.S. National Cholesterol Education Program (NCEP). Clin Chem 1991:37:656-661.
- Westgard JO, Hytoft Petersen P, Wiebe DA. Laboratory process specifications for assuring quality in the U.S. National Cholesterol Education Program (NCEP). Clin Chem 1991:37:656-661.
- Westgard JO. Error budgets for quality management: Practical tools for planning and assuring the analytical quality of laboratory testing processes. Clin Lab Manag Review 1996;10:377-403.