Normalized OPSpecs Chart, N=3, 50% AQA
A normalized OPSpecs chart with QC procedures with N=3, 50%AQA.
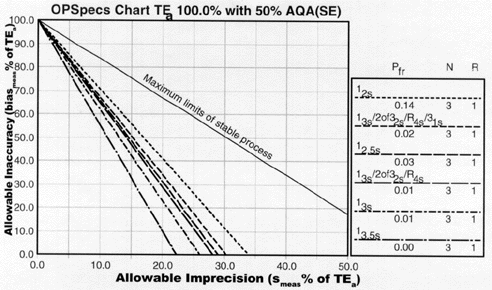
Directions: Plot your normalized OPSpecs Chart operating point. If there are lines in the chart that lie above your operating point, they assure you the %AQA (error detection) listed in the title.
Use the Normalized OPSpecs Calculator provided to calculate your normalized operating point.
See the Normalized OPSpecs Chart Lesson for more information.
If this chart does not provide you with a useful QC procedure, try the Normalized OPSpecs Chart for 50% error detection with N's of 6.