Quality Standards
Chloride Quality Goals
Continuing in our series of performance and goal comparisons, we evaluate the quality requirements and method performance of Chloride.
Chloride Quality: What's the right Goal? What's the actual performance?
Sten Westgard
November 2013
In October, we took a look at Albumin performance and quality requirements to make an assessment of which goals were achievable, and which methods were performing well. This month we're turning to a different analyte: Chloride.
What's the Right Goal for Chloride?
On a more specific level, even for laboratories that are attempting to assess and assure quality, the question of goals, targets and requirements are a challenge. The main question for labs is, "What is the Right Goal for this Test?" While the 1999 Stockholm hierarchy identifies an approach, the ideal quality goals - goals developed based on the evidence of how the test results are actually used by clinicians - are rare indeed. Even for well-studied assays that have been used in medicine for decades, there is still a wide disparity on the actual goal that should be used for quality.
| Analyte | Acceptance criteria / quality requirements | |||||
| CLIA | Desirable Biologic Goal |
RCPA | Rilibak | SEKK |
Spanish |
|
| Chloride | ± 5% | ± 1.5% | ± 3.0 mmol/L | ± 8% | ± 7% | ± 9% |
This table is adapted from a study by Friedecky, Kratochvila and Budina in a 2011 article in CCLM. You can see that the Desirable Biologic "Ricos goal" is quite small for Chloride, while Rilibak, SEKK, and the Spanish Minimum Consensus set the target much larger, around 8%. Remember that theser three sources, (Rilibak, SEKK and the Spanish Minimum Consensus goals) establish their goals by a process akin to "waiting for the arrow to land before painting the bulls-eye around it." That is, the Spanish consensus minimum goal is set so that 90% of labs can achieve the goal. Thus, no matter what performance of the assay is, the vast majority of labs will pass. The "Ricos goal," in contrast, is specified entirely along an evidence-based methodology, without regard to whether or not there are methods on the market that can hit such a small target. Interestingly, the RCPA goal is the only unit-based goal, which will provide a larger quality requirement at the low end of the range, but a smaller quality requirement near the upper end of the range.
Where can we find data on method performance?
Here is our standard caveat for data comparisons: it's really hard to get a good cross-instrument comparison study. While every lab has data on their own performance, getting data about other instruments is tricky. If we want true apples-to-apples comparisons of performance, moreover, we need to find a study that evaluates different instruments within the same laboratory under similar conditions. Frankly, those studies are few and far between. Not many labs have the time or the space to conduct head-to-head studies of different methods and analyzers. I've seen a lot of studies, but few gold-standard comparisons.
Proficiency Testing surveys and External Quality Assessment Schemes can provide us with a broad view, but the data from those reports is pooled together. Thus, we don't get individual laboratory standard deviations, we get instead the all-group SD or perhaps the method-specific group SD. As individual laboratory SDs are usually smaller than group SDs, the utility of PT and EQA reports is limited. If we want a better idea of what an individual laboratory will achieve with a particular method, it would be good to work with data from studies of individual laboratories.
In the imperfect world we live in, we are more likely to find individual studies of instrument and method performance. A lab that evaluates one instrument and its methods, compares it to a "local reference method" (i.e. usually the instrument it's going to replace). While we can get Sigma-metrics out of such studies, their comparability is not quite as solid. It's more of a "green-apple-to-red-apple" comparison.
Given those limitations, here are a few studies of major analyzer performance that we've been able to find in recent years:
- Evaluation des performances analytiques du systeme Unicel DXC 600 (Beckman Coulter) et etude de la transferabilite des resultats avec l’Integra 800 (Roche diagnostics), A. Servonnet, H. Thefenne, A. Boukhira, P. Vest, C. Renard. Ann Biol Clin 2007: 65(5): 555-62
- Validation of methods performance for routine biochemistry analytes at Cobas 6000 series module c501, Vesna Supak Smolcic, Lidija Bilic-Zulle, elizabeta Fisic, Biochemia Medica 2011;21(2):182-190
- Analytical performance evaluation of the Cobas 6000 analyzer – special emphasis on trueness verification. Adriaan J. van Gammeren, Nelley van Gool, Monique JM de Groot, Christa M Cobbeart. Clin Chem Lab Med 2008;46(6):863-871.
- Analytical Performance Specifications: Relating Laboratory Performance to Quality Required for Intended Clinical Use. [cobas 8000 example evaluated] Daniel A. Dalenberg, Patricia G. Schryver, George G Klee. Clin Lab Med 33 (2013) 55-73.
- The importance of having a flexible scope ISO 15189 accreditation and quality specifications based on biological variation – the case of validation of the biochemistry analyzer Dimension Vista, Pilar Fernandez-Calle, Sandra Pelaz, Paloma Oliver, Maria Josa Alcaide, Ruben Gomez-Rioja, Antonion Buno, Jose Manuel Iturzaeta, Biochemia Medica 2013;23(1):83-9.
- External Evaluation of the Dimension Vista 1500 Intelligent Lab System, Arnaud Bruneel, Monique Dehoux, Anne Barnier, Anne Bouten, Journal of Clinical Laboratory Analysis 2012;23:384-397.
- Evaluation of the analytical performances of the novel Beckman Coulter AU5800, Lippi G, Dipalo M, Musa R et al, Clinical Biochemistry 45 (2012) 502-504.
- Analytical evaluation of the clinical chemistry analyzer Olympus AU2700 Plus, Jasna Juricek, Lovorka Derek, Adriana Unic, tihana Serdar, Domagoj Marijancevic, Marcela Zivkovic, Zelljko Romic, Biochemica Medica 2010;20(3):334-40.
- Bias (Trueness) of Six Field Methods Estimated by Comparison to Reference Methods and Comparability of Results within a Family of Analyzers, D. Armbruster, Y. Lemma, G. Marseille, Poster at 2011 AACC conference.
These studies in turn can give us multiple data points (for instance, CV for high and low controls) for some instruments and we can attempt to evaluate these instruments' ability to achieve different quality requirements.
Can any instrument hit the Desirable Biologic TEa Goal for Chloride?
Here is a Method Decision Chart using the "Ricos Goal" of 1.5%.
[If you're not familiar with Method Decision Charts and Six Sigma, follow the links here to brush up on the subject.]
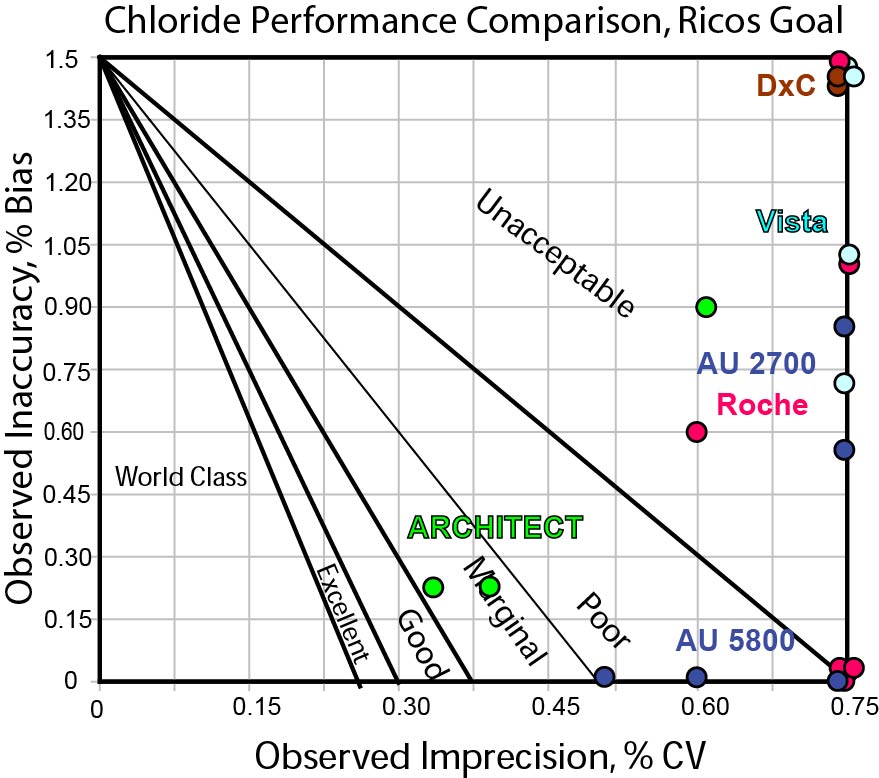
As you can see, this is a quality requirement that proves to be very, very hard to hit.
In any case, no method here is much better than another. If 1.5% were our goal, we might conclude that we need to run our testing in duplicate or find other drastic efforts necessary to achieve the needed performance.
Can any instrument hit the Rilibak interlaboratory comparison TEa goal for Chloride?
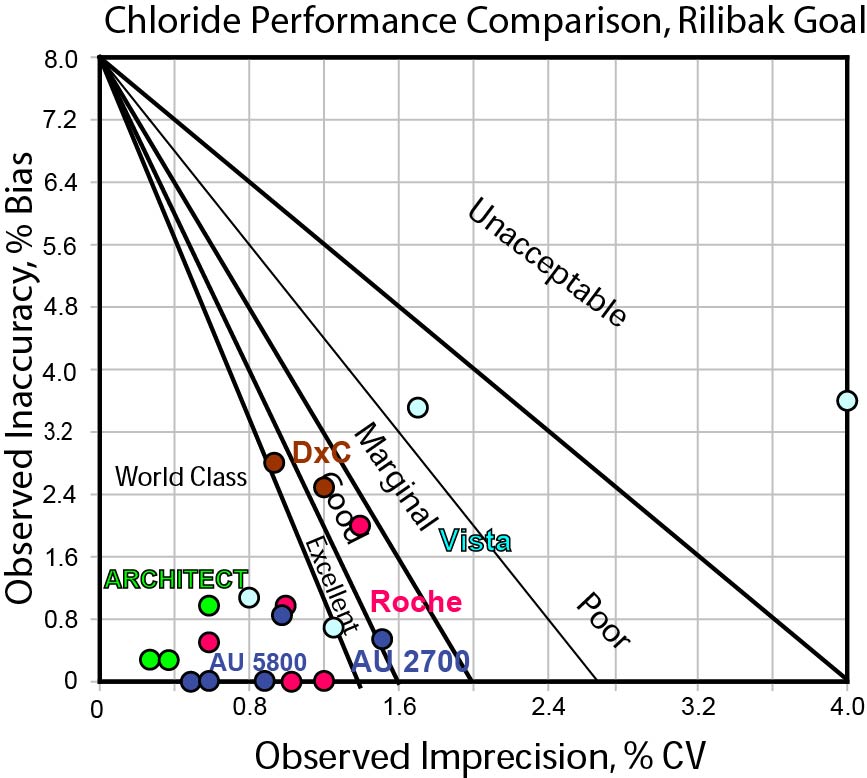
Here we see that basically all methods are in the bulls-eyes. If we accept that 8% is an appropriate target for Chloride, then any method will do.
Can any instrument hit the CLIA TEa Goal for Chloride?
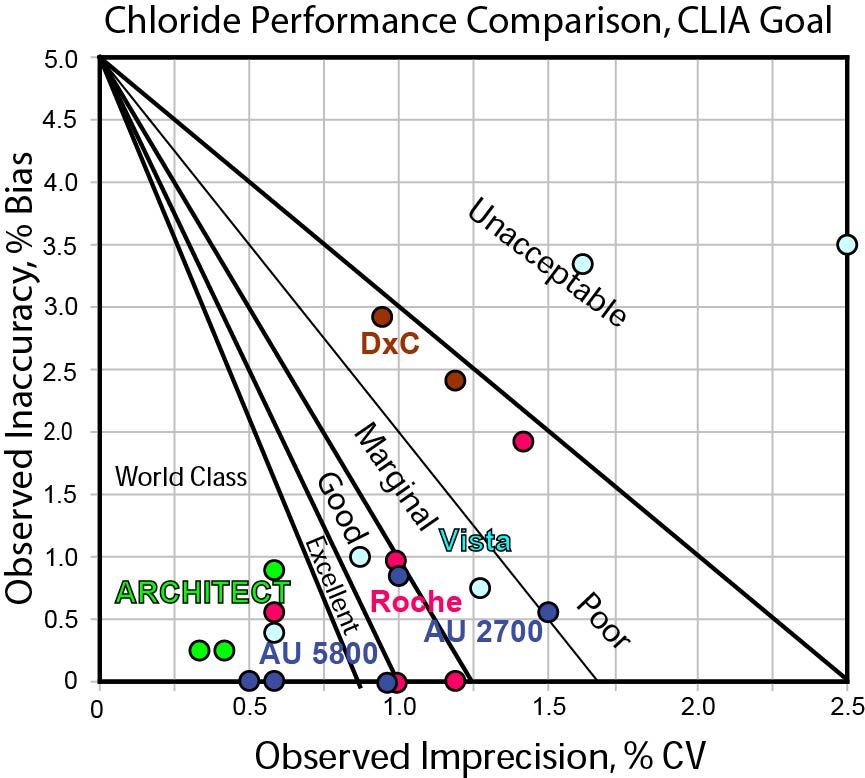
In this final graph, we see a few methods are in the bulls-eye, but the others are not. of method performance varies from 4 to 5 Sigma. Note that the data on the Vista is from two studies, and the data points from each study are different (this may mean we need to gather yet more data to reach a definitive conclusion on this method).
If we extend the implications of this analysis into QC design, we will see even more differentiation. The methods in the bulls-eye will have quite simple rules and fewer controls. The methods in the good, marginal and poor zones will need to use more and more "Westgard Rules" and increase their consumption of controls per run.
Conclusion
With quality requirements, there is no one source that is completely perfect and practical. Laboratories need to be careful when selecting quality goals, making sure that they choose the goals that they are mandated to meet (In the US, labs must be able to achieve CLIA targets), but also making sure that their goals are practical and in harmony with the actual clinical use of the test in their health system.
It appears here that CLIA is the more realistic target, possible to hit but not easy, providing some discriminatory power among different methods. The Rilibak goal, on the other hand, is probably too easy to achieve. The Ricos goal, finally, appears to be currently out of reach with the performance of all of today's methods.
Remember, from our perspective, a goal that no one (no method) can hit is not useful, except perhaps to instrument researchers and design engineers (for them, this becomes an aspirational target, to design the next generation of methods to achieve that ultimate level of performance). Neither is it helpful to use a goal that every method can hit - that might only indicate we have lowered the bar too much, and actual clinical use could be tightened and improved to work on a finer scale.
Like so much in laboratory medicine, there is still a lack of standardization and harmonization (we didn't even discuss the difference between BCG and BCP), and a healthy debate about what needs to be achieved. In future articles, we hope that we can make it easier to see the differences in quality requirements, method performance and the practical choices that labs can make.