Basic QC Practices
What changed with this QC?
Here's a laboratory quality control mystery. See if you can guess what happened with the following real-world QC situation...
What changed with this QC?
Sten Westgard, MS
March 2014
We are lucky to have a generous membership. Recently, a laboratory forwarded their performance data on 25 to 26 different chemistry analytes on three of their instruments. They recently saw a significant change in performance and wanted to share this. It's an interesting scenario, and actually a not uncommon one.
Setting the scene...
First, let's begin by stating we'll be using the Sigma-metric and the Sigma Method Decision chart as the visualization tool. We'll look at a two-month period of data before the change, and then at the three month period of data after the change. The Sigma-metrics are calculated from the same quality requirements for all data sets (predominantly CLIA), with imprecision estimated from the control material data from each of those periods, and with bias estimated as the difference between the lab control mean and the peer group mean for that period.
We'll keep the names of the instrument blinded, since this is not primarily an instrument problem (OK, so we just eliminated one possibility).
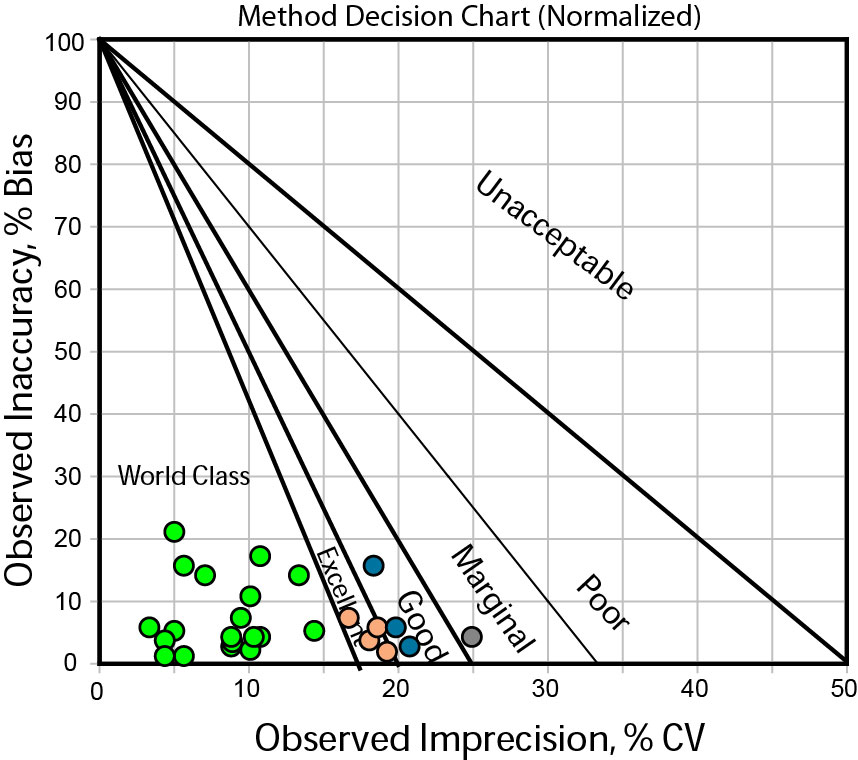
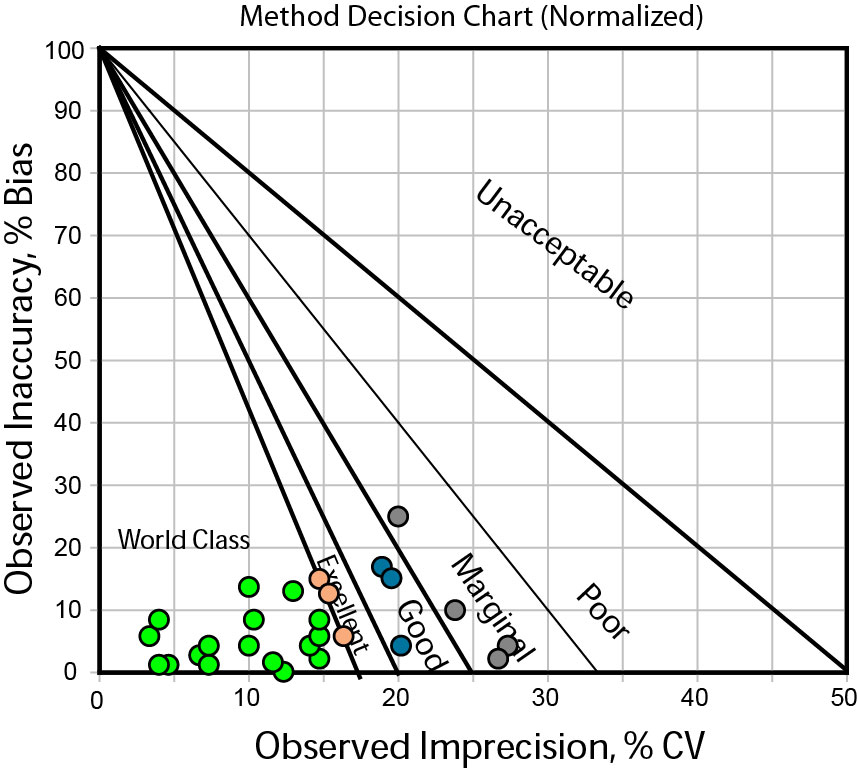
High Volume Chemistry Instrument #1
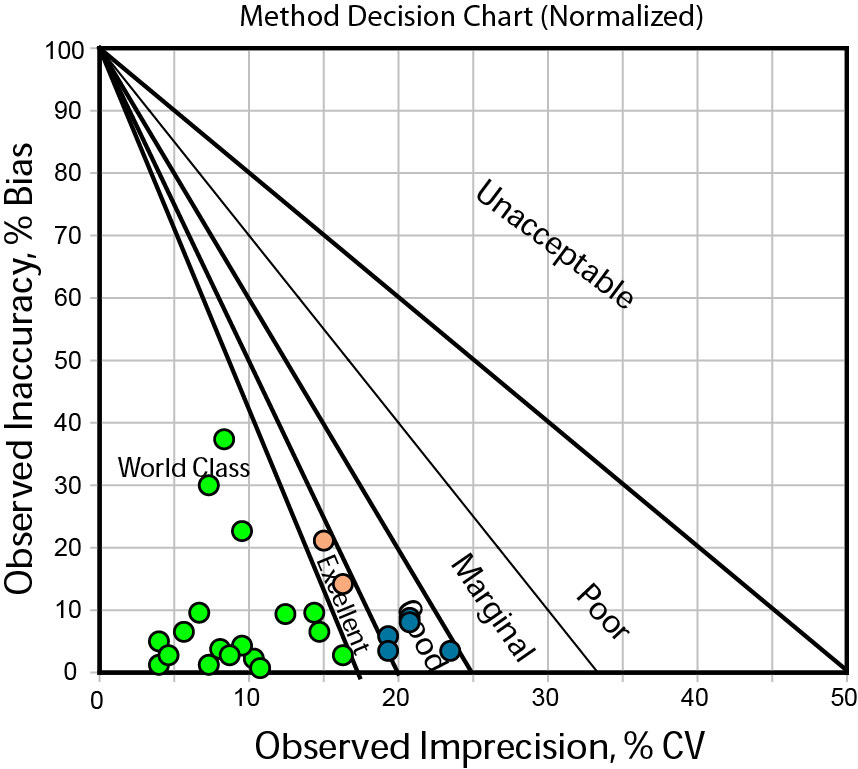
Here you can see 25 methods, with 18 better than 6 Sigma (green), 2 methods at 5 Sigma (tan), and 5 methods at around 4 Sigma (blue).
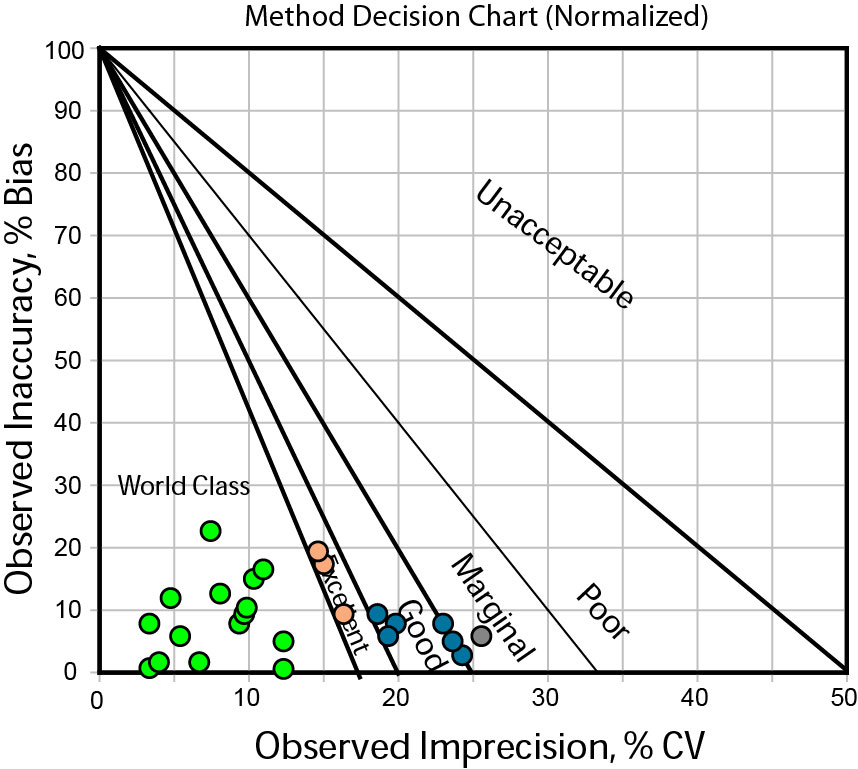
Here is the same instrument after the change. Now there are 15 methods at 6 Sigma or better, 3 methods at 5 sigma, 6 methods at 4 Sigma, and 1 method around 3 Sigma.
High Volume Chemistry Instrument #2
This is the same instrument model as the first instrument, but we're looking at 26 methods this time. Just one additional chemistry analyte is being analyzed here.
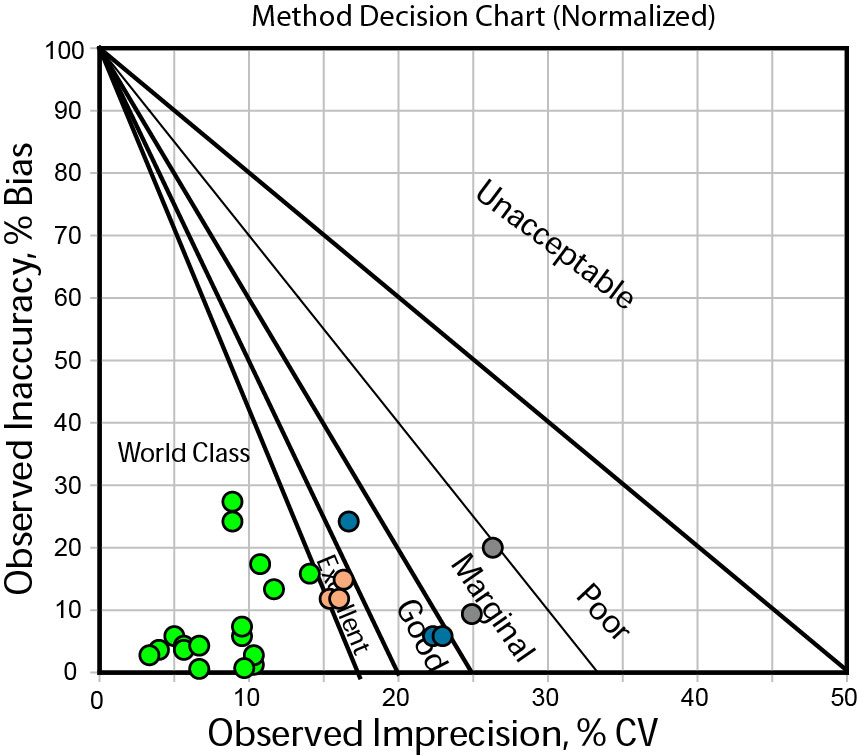
Here we see 17 methods at 6 Sigma, 3 methods at 5 Sigma, 3 methods at 4 Sigma, and 2 methods at 3 Sigma.
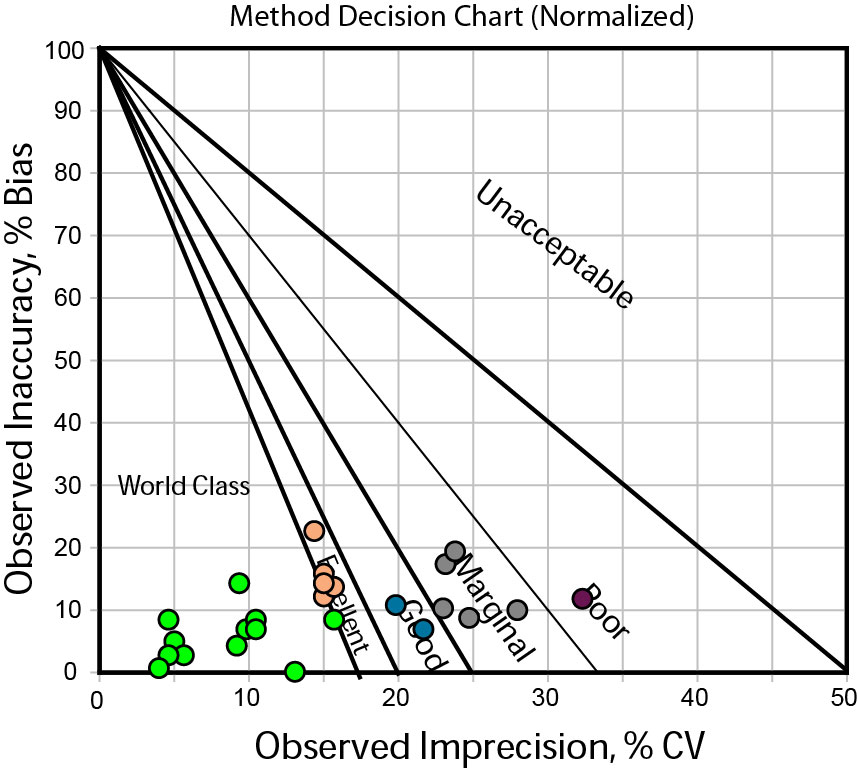
After the change, there are 11 methods at 6 Sigma, 5 methods at 5 Sigma, 2 methods at 4 Sigma, 5 Methods at 3 Sigma and one method at below 3 Sigma.
Medium Volume Chemistry Analyzer
Here's a picture of performance of a smaller, mid-volume chemistry analyzer, but from the same "family" of instruments as the previous two.
There are 19 methods better than 6 Sigma, 4 methods at 5 Sigma, 3 methods at 4 Sigma, and 1 method at 3 Sigma.
After the change there are 17 methods at 6 Sigma, 3 methods at 5 Sigma, 3 methods at 4 Sigma, and 4 methods at 3 Sigma.
What's going on?
In this situation, the number of analytes performing at 6 Sigma or better is declining on all instruments, between 10 to 35%, while the number of analytes performing below 6 Sigma is increasing by between 25 to 60%. There's a definite shift in away from optimal performance. And the change is happening on all three instruments.
I realize that there is a lot of information that isn't being presented here. You'd probably like to know about the specific analytes, specific decision levels where controls are being run, and a myriad of operational details. Here are some further clues:
- the instruments and methods are the same - no new modifications or mechanical changes
- reagents, calibrators didn't change - it's not a lot-to-lot issue on the instrument
- no water issue or contaminations in the laboratory
- no pre-analytical issues or errors introduced by personnel
- no recall took place
Think you know what the problem is yet?
The mystery revealed
What changed with this QC was ... the QC was actually changed. The lab switched from one type of control material to another. And the changes reflect the performance of the control material more than the performance of the method or instrument.
This goes to a hidden assumption about QC materials - that they all behave the same, are equivalent and interchangeable. In an ideal world, controls would simply be a commodity, and there would be no difference between Company A's controls and Company B's controls - all that would matter is price and other commercial terms. What this scenario reveals, however, is that controls materials can be very different. The choice of control material can affect the QC practices you have to implement on an instrument.
With quality, we can never assume, we must always assure and verify. Choosing the Right QC means not only choosing the Right method, the Right rules, the Right number of controls, but also the Right control material.
The outcome from this particular scenario is that the laboratory switched back to the control material they were using in the first place (all of the Before snapshots). In a few months, we hope to be able to show their performance data once they returned to the original control material.