Quality Standards
Setting Method Specifications for Glycated Hemoglobin
In the March 2002 issue of Clin Chem, the NACB published a 36 page report about the use of laboratory tests for patients with diabetes. It's probably the longest paper ever published by Clin Chem. Dr. Westgard examined the "evidence-based" recommendations, though, and found some poor Sigma values. Here, using Validator software, Dr. Westgard demonstrates how to set useful method specifications for GHb.
GLYCATED HEMOGLOBIN SPECIFICATIONS
An example is presented here using a clinical quality requirement to develop method performance specifications and QC recommendations. This glycated hemoglobin (GHb) example is based on the "evidence-based" guidelines and recommendations from the National Academy of Clinical Biochemistry as published in March 2002 [1]. This application makes use of our QC Validator 2.0 computer program. See the accompanying essay on evidence-based medicine, QC, and specifications.
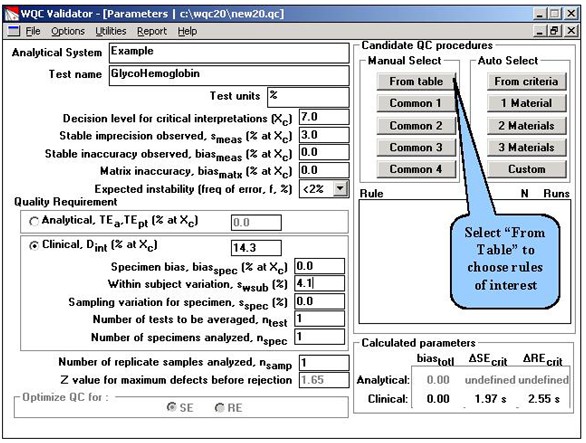
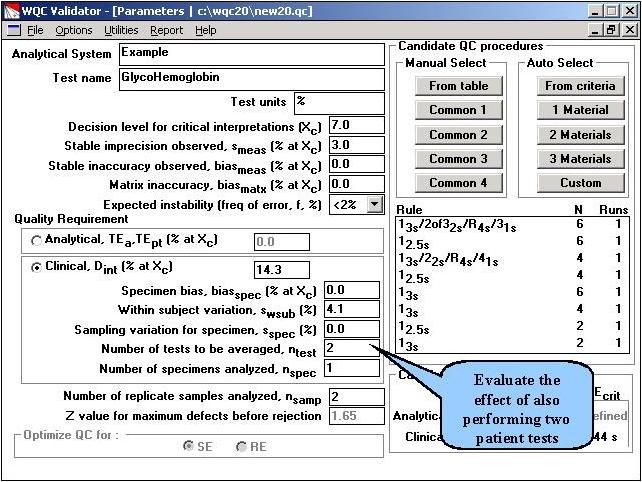
Step 1. The input parameters shown correspond to the recommended method imprecision (3.0%), inaccuracy (0.0%), and clinical quality requirement of 14.3% (8.0-7.0)/7.0]. Within-subject biological variation is entered as 4.1% [2]. Other parameters are left at their default settings. To evaluate different QC rules, we will make the selections manually from the table of available rules.
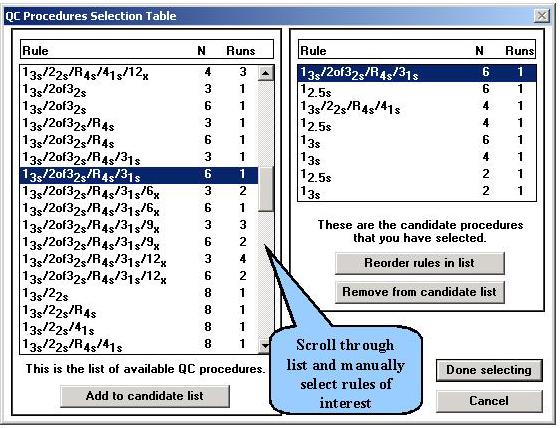
Step 2. A wide variety of statistical rules are available in this table. Only about 1/5 of them can be seen in this screen. You scroll through the list and manually click on the rules to select them for study. The list of selected rules is shown at the right and represent single and multirule procedures having 2 to 6 control measurements per run.
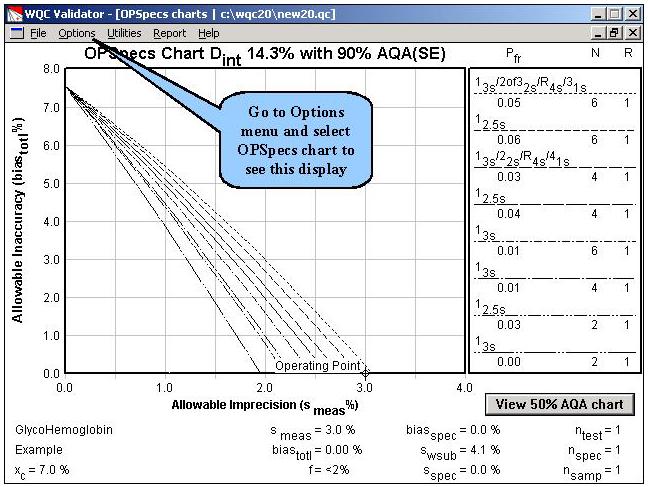
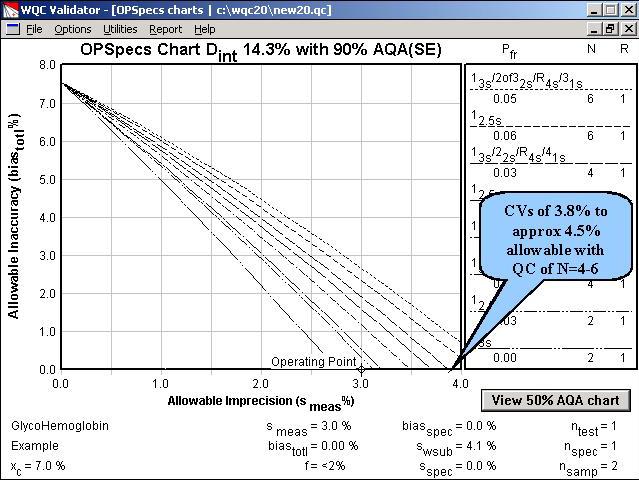
Step 3. From the Options menu, the OPSpecs chart has been selected. The chart has been prepared for the clinical decision interval of 14.3% and 90% AQA(SE) or error detection. It shows the amount of inaccuracy (y-axis) and imprecision (x-axis) that are allowable for the different candidate QC procedures. The performance of an NACB method is shown by the operating point (x=3.0, y=0.0). Only a multirule procedure with N=6 will provide 90% detection of medically important systematic errors.
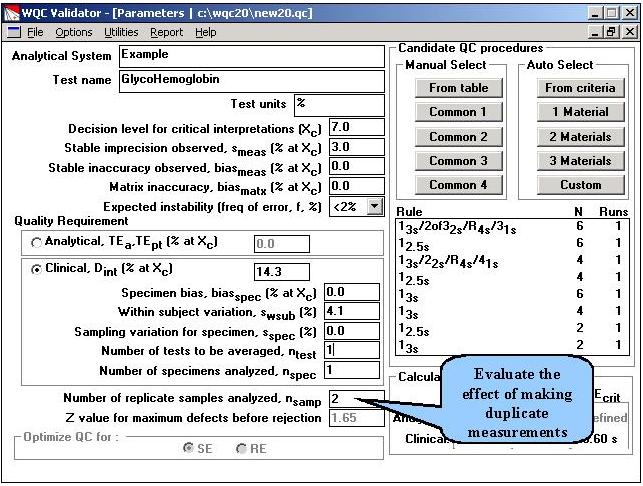
Step 4. To evaluate the effect of making duplicate measurements on each patient and control sample, the number of replicates is changed from 1 to 2, as shown on this screen. All other parameters are the same as earlier. The OPSpecs chart is then selected from the Options menu.
Step 5. This OPSpecs chart shows that operating limits for the different QC procedures have increased, due to making replicate measurements. Methods with CVs from 3.0% to approximately 4.5% would be clinically useful if duplicate measurements were made.
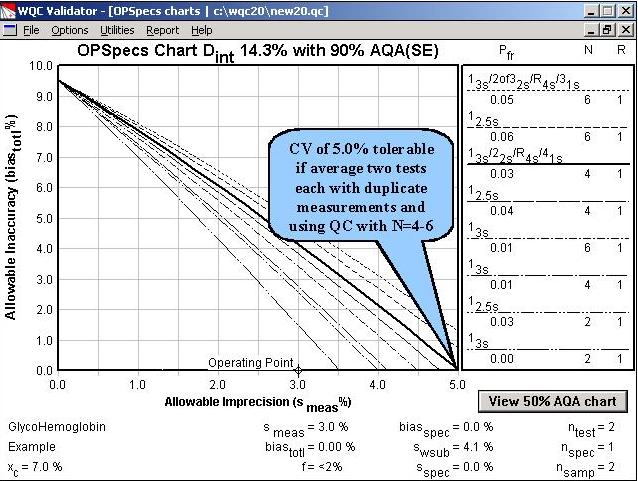
Step 6. To evaluate the further effect of performing multiple tests on a patient, the input parameters are changed to indicate that 2 test results will be averaged. Duplicate measurements will also be made on all patient and control samples. The OPSpecs chart is then selected from the Options menu.
Step 7. Methods with CVs as large as 5.0 to 5.5% would be clinically useful if two patient tests were performed and duplicate measurements were made by the method.
References:
- Sacks DB, Bruns DE, Goldstein DE, Maclaren NK, McDonald JM, Parrott M. Guidelines and recommendations for laboratory analysis in the diagnosis and management of diabetes mellitus. Clin Chem 2002;48:436-472.
- Lytken Larsen M, Fraser CG, Hyltoft Petersen P. A comparison of analytical goals for haemoglobin Alc assays derived using different strategies. Ann Clin Biochem 1991;28:272-278.
