Quality Requirements and Standards
Perspectives on Analytical Quality Management, Part 4
In the debate over new models for QC, keep your eyes wide open. Sometimes the desire for something new and different blinds you from seeing the strength of the present.
Perspectives on Analytical Quality Management, Part 4.
The Temporal Assessment of QC Data
James O. Westgard,PhD
October 2022
Things are going to slide in all directions
Won’t be nothing
Nothing you can measure any more
The blizzard of the world
has crossed the threshold
and it has overturned
the order of the soul
When they said REPENT
I wondered what they meant
Leonard Cohen, The Future
Previous discussions in this series described how the selection and design of SQC procedures evolved up to about the early 2000s. Power Function Graphs and Charts of Operating Specifications provided QC planning tools for assessing the probabilities for rejection under different error conditions. For the situation of stable operation based on the inherent imprecision of a method, the probability for false rejection (Pfr) characterizes the chance of false error flags, thus ideally Pfr should be as close to 0.00 as possible. In practice, Pfr up to 0.05, or 5.0% false rejections, has been considered acceptable performance. For the situation of a critical sized systematic error that is medically important, the probability for error detection (Ped) should be high, ideally 0.90 or 90% or better.
A general planning process based on optimizing Pfr and Ped was described in the literature in 1994 [1]. This planning approach was formalized in the 3rd edition of CLSI C24 published in 2006 [2] and further expanded in the 4th edition published in 2016 [3]. The 3rd edition included a power function graph for common single and multirule procedures with Ns from 1 to 6 to provide a practical tool for selecting appropriate QC rules and Ns, as well as illustrating the various QC procedures that would be practical for tests with different Sigma performance.
What was missing in the 3rd edition formulation of the QC planning process was a specification for the frequency of QC. For a Batch process or a Critical Control Point application, the old approach was sufficient to identify the appropriate control rules and the necessary number of control measurements. However, for a continuous production process which represents the operation of many of today’s high-volume analyzers, there is a need to also specify how often controls should be analyzed, i.e., the frequency of QC events. The 4th edition (C24-Ed4) resolved this issue by recommending a risk-based SQC strategy for assessing SQC performance based on Dr. Curtis Parvin’s patient risk model [4].
Influence of Risk Management
In the last decade, the principles of risk management have been recommended and adopted in medical laboratories. For example, in 2011 CLSI published EP23-A to provide guidance for “Laboratory quality control based on risk management” [5]. This approach led to recommendations for developing QC Plans that provide broad application to the Total Testing Process. One example of impact is the option for an Individualized QC Plan (IQCP) to satisfy QC compliance in the US CLIA regulations.
A limitation of risk management is that most applications involve extremely subjective judgments of the frequency of occurrence of errors, the detection capability of control mechanisms, and the severity of harm to patients. Typically, these factors are ranked on a scale from 1 to 5, or 1 to 10, then those rankings combined to provide a risk score. The usual tool to facilitate risk assessments is called Failure Mode and Effects Analysis, or FMEA. While FMEA tables look impressive, they suffer from both being qualitative and difficult to reproduce from lab to lab, or even within a laboratory. When applied to laboratory QC, they are useful for integrating control mechanisms for pre-analytic and post-analytic phases of the testing process, but of limited help for the analytic phase, except to complement SQC by adding specific control mechanisms for individual failure-modes that cannot be assessed by the measurement of QC materials, e.g., lipemia, hemolysis.
For that reason, it is better to implement a risk-based SQC strategy that is quantitative and reproducible, then add specific instrument checks and function tests recommended by the manufacturer, as well as pre-analytic and post-analytic control mechanisms, to construct a Total QC Plan. Thus, a laboratory’s QC Plan should consist of SQC to monitor the many variables that affect the measurement process and specific control mechanisms to monitor known failure modes that cannot be monitored by SQC.
QC Frequency and Patient Run Size
One of the outcomes of “risk-based thinking” was Parvin’s development of a patient risk model that provides objective guidance for the frequency of QC events, i.e, how often QC materials should be analyzed [3]. Parvin also chaired the committee that developed the 4th edition of the C24 guidance for QC. One of the significant changes in the QC planning process was to consider “the risk of harm to a patient if an erroneous result is reported” [3, section 5.5.2.6, page 37]. That section advises that “the frequency of measuring QC samples may be determined primarily by the risk that an erroneous result could cause harm to a patient before the error condition would be identified by the next scheduled QC event and the patient specimen result could be corrected.”
The details of Parvin’s patient risk model are found in the scientific literature [5]. These calculations are difficult to carry out in service laboratories, thus graphical tools have been developed to empower practical applications, first by Yago and Alcover for single-rule QC procedures [6] and by Bayat for multirule procedures [7]. A Sigma Run Size Nomogram was also developed [8] to support C24-Ed4 applications. The practical impact is that QC frequency can now be objectively assessed in terms of the number of patient samples between QC events, or “run size.”
SQC Planning Process
Figure 1 shows the steps in the SQC planning process. The first 3 steps involve getting the information needed to calculate the Sigma-Metric for the method based on the defined allowable Total Error for the intended use of the test and the precision and bias observed for the method in use in the laboratory. Once Sigma is known, QC planning tools such as the Sigma Run Size Nomogram are used to select an appropriate SQC strategy, which defines the control rules, number of control measurements, and frequency of QC events.
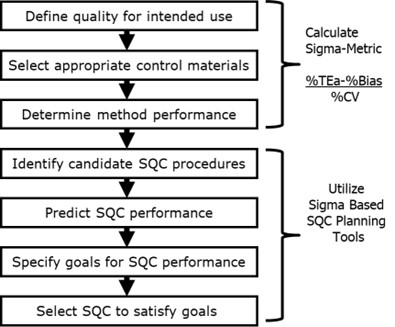
Figure 1. Steps for determining an SQC strategy that defines the appropriate control rules, number of control measurements, and frequency of QC events.
Example HbA1c Application
Figure 2 is a Sigma-Metric Run Size Nomogram for selecting SQC strategies for which the maximum increase in the number of reported erroneous patient test results before detection would be 1, i.e., Parvin’s MaxE(Nuf) patient risk parameter is 1. The nomogram shows run size on the y-axis (on a logarithmic scale) vs the Sigma-Metric on the x-axis. The lines on the nomogram represent different QC rules and Ns, as shown in the key at the right. To select an appropriate SQC strategy for a 4-Sigma method, e.g., HbA1c with a 6.0% quality requirement, 0.0% bias, and 1.5% CV, a vertical line is drawn at 4.0 on the x-axis. The intersections of that line with the various QC lines identify the appropriate run sizes. For example, a run size of 190 patient samples would be appropriate when an N=4 multirule procedure is used. For comparison, you can assess the run size for a 1:3s N=2 QC procedure, which would be approximately 20-25, and the run size for a 1:3s N=1 QC procedure, which would be less than 10 patient samples between QC events.
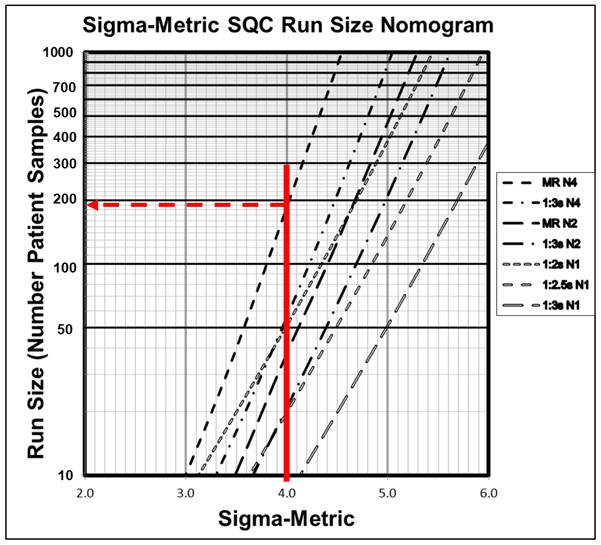
Figure 2. Sigma-metric Run Size Nomagram (for patient risk factor of 1) showing an example 4-Sigma method where an appropriate SQC strategy would be a 1:3s/2:2s/R:4s/4:1s multirule procedure with 4 control measurements/QC event and 190 patient samples between QC events.
Longitudinal Evaluation of QC Data
The metrologists new recommendations [9] for redesigning IQC emphasize (a) the use of fixed clinical control limits based on a 95% acceptance range (TV ± 2*APSu) and also (b) “longitudinal evaluation” for QC data from continuous production processes.
“In the continuous mode, which is now typical for laboratories using total automation, QC materials should be measured periodically along with clinical samples. CLSI C24 called this type of QC schedule “bracketed QC” and suggests considering several potential influencing factors in defining QC frequency. In our core-lab facility, working by a continuous first come/first-serve processing of samples, we perform QC component I three times per day, i.e., every 8 h.”
It should be noted that bracketed QC in the CLSI C24-Ed4 terminology does not have the same meaning as “QC materials should be measured periodically.” Rather it refers to a practice where patient test results are reported only when the patient samples are between two passed or in-control bracketing QC events. While they acknowledge that “the establishment of this frequency is central”, they caution that “determination of the optimal QC frequency may require the application of sophisticated statistical models...” While metrology world where has a long history of complicated mathematical models for estimating MU, e.g., the GUM bottom-up methodology that was widely discussed and recommended in recent years, they seem to have avoided any application of that to QC frequency.
As we demonstrate in the example in Figure 2 above, the optimal QC frequency depends on the Sigma quality of the method (which accounts for the quality required for intended use and the precision and bias observed for the method) and the desired patient risk. Frequency of QC events can be easily determined with available QC planning tools and it is obvious that a single fixed clinical limit, such as 1:3s N=1, is not adequate for a 4-Sigma HbA1c method.
Panteghini argues that “two full columns of our Perspective article were devoted to discussing this issue. We rather stated that ‘this approach, i.e., checking if the single control value is (or is not) in the acceptable range, if used in isolation is not sensitive and precocious enough to prevent poor quality results on clinical samples. The interpretation of [component I] results by checking their temporal trend without waiting for out-of-control signs is surely more effective.” There are no recommendations given on how to check for "temporal trends", but we illustrate in the HbA1c example that this can be done using the 2:2s and 4:1s rules in an N=4 multirule procedure. But, each QC event requires 4 control measurements every 190 patient samples, not a single control assayed arbitrarily every 8 hours, regardless of patient workload.
Checking for temporal or longitudinal trends requires proper selection of control rules, not just a casual inspection of the data on a control chart. Use of a clinical fixed control limit with casual inspection for trends will be neither reliable nor rugged, particularly for service laboratories with large numbers of analysts. However, a proper QC design with appropriate trend rules can be readily accomplished using the QC planning process recommended by CLSI C24-Ed4. When needed, trend rules are identified to boost the error detection of single rules.
What’s the point?
An independent study on the “Early Assessments of Analytical Performance for a Possible Transition from an Internal Quality Control (IQC) System Based on the Total Error Model to a System Based on Measurement Uncertainty”, was presented as a poster at the 54th Congresso Nazionale SIBioC [10]. Those authors concluded:
“Implementing an IQC system within the MU framework requires obtaining metrological traceability data of the calibrators from the manufacturer and selecting MU-specific APS, but these are often missing. Furthermore, another crucial issue is to establish criteria for the acceptance of IQC results in daily practice. For this reason, setting up an IQC system based on measurement uncertainty is challenging task that needs to be fine tuned before this model is successful.”
The phrase, “needs to be fine tuned,” diplomatically understates the problem. The metrology-suggested approach using APS for MU as fixed clinical control limits needs to be abandoned. The risk-based SQC strategy, developed on a strong foundation of analytical performance specifications and Sigma-metrics, is readily available, enshrined in the CLSI C24-Ed4 guideline, bolstered with practical (and for the most part, free) tools for planning and design of QC.
Recently, I was told, “keep your eyes wide… as the present now will later be past” which I guess must be a type of cryptic warning. I was further encouraged to "please come to the new road if you can lend your hand." But I find no merit in building a new road to nowhere, no matter how many hands contribute. There is a strong foundation for a better road, laid down with decades of work on theory, tools, and real-world experience, and this highway is already open to all. I encourage the metrologists to lend their hands so this road can take everyone to better quality.
References
- Westgard JO. A QC planning process for selecting and validating statistical QC procedures. Clin Biochem Revs 1994;15:156-164.
- CLSI C24-A3. Statistical Quality Control for Quantitative Measurement Procedures: Principles and Definitions – Third Edition. Clinical and Laboratory Standards Institute, 950 West Valley Road, Suite 2500, Wayne PA, 2006.
- CLSI C24-Ed4. Statistical Quality Control for Quantitative Measurement Procedures: Principles and Definitions – Fourth Edition. Clinical and Laboratory Standards Institute, 950 West Valley Road, Suite 2500, Wayne PA, 2016.
- CLSI EP23-A. Laboratory Quality Control Based on Risk Management. Clinical and Laboratory Standards Institute, 950 West Valley Road, Suite 2500, Wayne PA, 2011.
- Parvin CA. Assessing the impact of the frequency of quality control testing on the quality of reported patient results. Clin Chem 2008;54:2049-2054.
- Yago M, Alcover S. Selecting statistical procedures for quality control planning based on risk management. Clin Chem 2016;62:959-965.
- Bayat H. Selecting multi-rule quality control procedures based on patient risk. Ms accepted by Clin Chem Lab Med 2017;55:1702-1708.
- Bayat H, Westgard SA, Westgard JO. Planning risk-based SQC strategies: Practical tools to support the new CLSI C24Ed4 guidance. J Appl Lab Med 2017;2:211-221.
- Braga F, Pasqualetti S, Aloisio E, Panteghini M. The internal quality control in the traceability era. Clin Chem Lab Med 2021;59:291-300.
- Franzoni A, Lonati A, Melcore AM, et al. Early assessment of analytical performance for a possible transition from an Internal Quality Control (IQC) system based on the Total Error model to a system based on Measurement Uncertainty. (Poster) Congresso Nazionale SIBioC, Biochimica Clinica, 2022;46:EP159, S128.
- Panteghini M. Reply to Westgard et al.: ‘Keep your eyes wide… as the present now will later be past.’ LTE: Clin Chem Lab Med 2022; https://doi.org/10.1515/cclm-2022-0557.