


WESTGARD WEB
Break All the Rules - Answers to Part Two
The answers to Part 2 of our QC basic interpretation series. Now we see what happens when we have 2 controls, and need to interpret across materials, across levels, and across runs.
Break All the Rules! (Answers to Part Two)
Sten Westgard, MS
November 2015
We're continuing in our effort to break all the "Westgard Rules." As we'll soon see, Part One was easy - just one control to worry about. Now that we've got two controls, we're going to have to start looking in many directions to detect the errors.
The data - converted to z-scores
Recall that low control has a mean of 47 and an SD of 3 and a high control has a mean of 71 and an SD of 8. Rather than deal in the "raw" numbers, we're going to convert those values into z-scores, which tell you how many standard deviations each point is from the mean. It's easier to pick up the rule violations this way.
Control Measurement |
Value 1
|
Z-value 1
|
Value 2 |
Z-value 2 |
Rule Broken |
| 1 | 51.5 | 1.5 | 82.2 | 1.4 | |
| 2 | 38.9 | -2.7 | 51 | -2.5 | 2:2s on both |
| 3 | 47.6 | 0.2 | 74.2 | 0.4 | |
| 4 | 46.0 | -0.33 | 91.8 | 2.6 | |
| 5 | 50.9 | 1.3 | 74.2 | 0.4 | |
| 6 | 53.9 | 2.3 | 69.0 | -0.25 | |
| 7 | 52.7 | 1.9 | 58.2 | -1.6 | |
| 8 | 49.1 | 0.7 | 95.5 | 3.06 | 1:3s on 2 |
| 9 | 48.5 | 0.5 | 65.4 | -0.7 | |
| 10 | 37.0 | -3.33 | 90.0 | 2.375 | 1:3s on 1 and R:4s on both |
| 11 | 47.0 | 0 | 63.0 | -1 | |
| 12 | 54.0 | 2.33 | 82.2 | 1.4 | |
| 13 | 53.3 | 2.1 | 65.4 | -0.7 | 2:2s on 1 |
| 14 | 40.0 | -2.33 | 86.2 | 1.9 | R:4s by calc |
| 15 | 55.4 | 2.8 | 70.2 | -0.1 | |
| 16 | 49.4 | 0.8 | 88.6 | 2.2 | |
| 17 | 46.7 | -0.1 | 87.8 | 2.1 | 2:2s on 2 |
| 18 | 45.8 | -0.4 | 85.0 | 1.75 | |
| 19 | 52.7 | 1.9 | 76.6 | 0.7 | |
| 20 | 51.1 | 1.4 | 65.4 | -0.7 | |
| 21 | 54.0 | 2.33 | 86.2 | 1.9 | |
| 22 | 53.0 | 2 | 71.0 | 0 | 4:1s on 1 and 2:2s on 1 |
| 23 | 49.7 | 0.9 | 81.4 | 1.3 | |
| 24 | 48.2 | 0.4 | 90.2 | 2.4 | |
| 25 | 46.4 | -0.2 | 80.6 | 1.2 | |
| 26 | 54.2 | 2.4 | 54.0 | -2.12 | R:4s |
| 27 | 51.2 | 1.4 | 53 | -2.25 | |
| 28 | 53.9 | 2.3 | 76.6 | 0.7 | |
| 29 | 44.3 | -0.9 | 72.6 | 0.2 | |
| 30 | 48.5 | 0.5 | 84.6 | 1.7 |
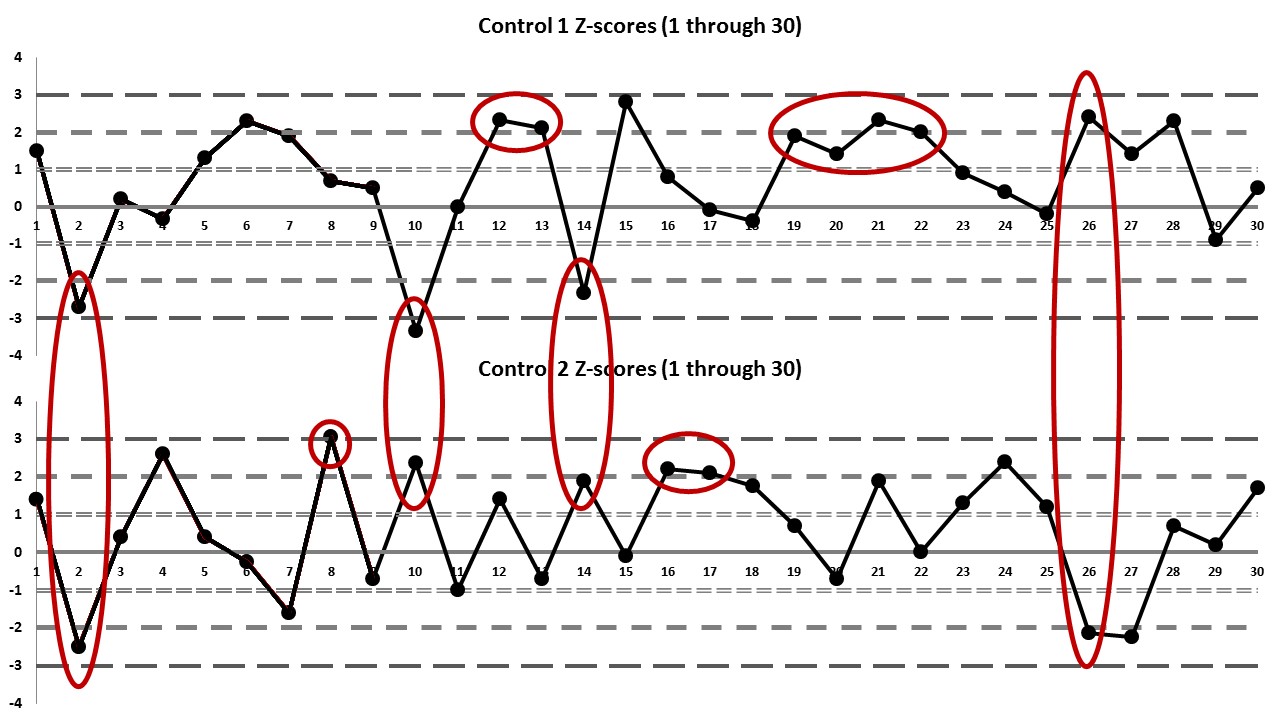
To make it a little easier to see the errors, we've marked them on a Levey-Jennings chart with z-scores for these first 30 values:
Control Measurement |
Value 1
|
Z-value 1
|
Value 2 |
Z-value 2 |
Rule Broken |
| 31 | 48.5 | 0.5 | 85.4 | 1.8 | |
| 32 | 48.8 | 0.6 | 86.2 | 1.9 | |
| 33 | 46.7 | -0.1 | 80.0 | 1.12 | |
| 34 | 46.1 | -0.3 | 79.9 | 1.11 | 4:1s on 2 |
| 35 | 46.0 | -0.33 | 83.8 | 1.6 | |
| 36 | 53.9 | 2.3 | 68.0 | -0.37 | |
| 37 | 43.0 | -1.33 | 64.6 | -0.8 | |
| 38 | 42.0 | -1.67 | 71.0 | 0 | |
| 39 | 40.0 | -2.33 | 83.0 | 1.5 | |
| 40 | 42.5 | -1.5 | 67.0 | -0.5 | 4:1s on 1 |
| 41 | 50.3 | 1.1 | 74.2 | 0.4 | |
| 42 | 44.3 | -0.9 | 46.0 | -3.12 | 1:3s on 2 |
| 43 | 51.8 | 1.6 | 71.8 | 0.1 | |
| 44 | 41.9 | -1.7 | 59.8 | -1.4 | |
| 45 | 40.0 | -2.33 | 57.0 | -1.75 | 4:1s on both |
| 46 | 48.8 | 0.6 | 86.2 | -2 | |
| 47 | 53.0 | 2 | 55.0 | -0.12 | |
| 48 | 52.4 | 1.8 | 70.0 | 1 | |
| 49 | 38.0 | -3 | 79.0 | -0.12 | 1:3s on 1 |
| 50 | 49.1 | 0.7 | 70.0 | -0.25 | |
| 51 | 44.0 | -1 | 69.0 | -0.25 | |
| 52 | 48.8 | 0.6 | 75.0 | 0.5 | |
| 53 | 50.6 | 1.2 | 76.6 | 0.7 | |
| 54 | 43.7 | -1.1 | 72.6 | 0.2 | |
| 55 | 47.6 | 0.2 | 80.0 | 1.12 | |
| 56 | 45.5 | -0.5 | 79.0 | 1 | |
| 57 | 44.3 | -0.9 | 74.0 | 0.37 | |
| 58 | 52.4 | 1.8 | 82.0 | 1.37 | |
| 59 | 53.9 | 2.3 | 72.0 | 0.12 | 8:x on 2 |
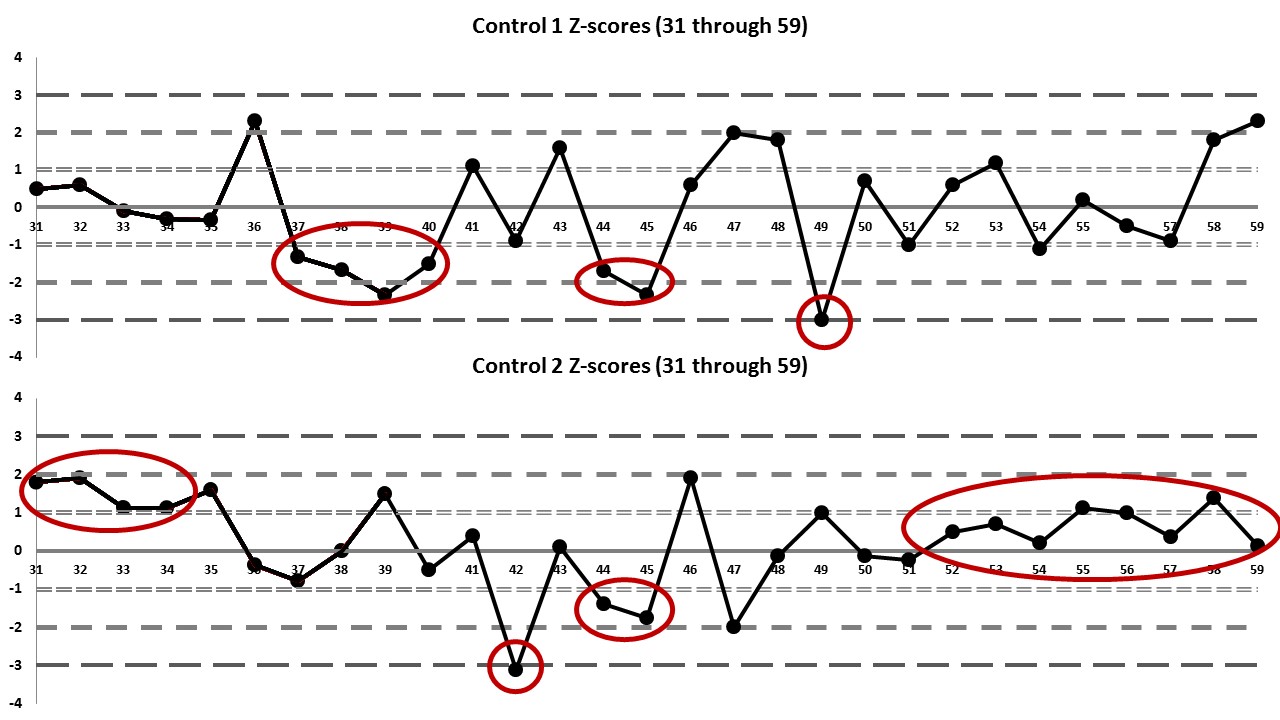
Here is the second set of Levey-Jennings charts for values 31 through 59:
Control Measurement |
Value 1
|
Z-value 1
|
Value 2 |
Z-value 2 |
Rule Broken |
| 60 | 45.8 | -0.4 | 74.2 | 0.4 | |
| 61 | 50.6 | 1.2 | 64.6 | -0.8 | |
| 62 | 48.0 | 0.33 | 71.0 | 0 | |
| 63 | 49.0 | 0.67 | 83.0 | 1.5 | |
| 64 | 51.0 | 1.33 | 67.0 | -0.5 | |
| 65 | 53.0 | 2 | 74.2 | 0.4 | |
| 66 | 48.0 | 0.33 | 80.6 | 1.2 | |
| 67 | 49.0 | 0.67 | 71.8 | 0.1 | |
| 68 | 50.0 | 1 | 69.4 | -0.2 | 8:x on 1 |
| 69 | 47.8 | 0.26 | 81.4 | 1.3 | |
| 70 | 45.5 | -0.5 | 65.4 | -0.7 | |
| 71 | 46.0 | -0.33 | 70.0 | -0.12 | |
| 72 | 45.0 | -0.67 | 69.0 | -0.25 | |
| 73 | 46.0 | -0.33 | 66.0 | -0.62 | 8:x on both |
| 74 | 47.9 | 0.3 | 68.6 | -0.3 | |
| 75 | 48.5 | 0.5 | 86.2 | 1.9 | |
| 76 | 50.9 | 1.3 | 59.8 | -1.4 | |
| 77 | 46.7 | -0.1 | 67.8 | -0.4 | |
| 78 | 47.8 | 0.26 | 86.2 | 1.9 | |
| 79 | 50.3 | 1.1 | 72.6 | 0.2 | |
| 80 | 52.0 | 1.67 | 81.4 | 1.3 | |
| 81 | 52.0 | 1.67 | 74.2 | 0.4 | 8:x on both |
| 82 | 48.5 | 0.5 | 80.6 | 1.2 | |
| 83 | 44.3 | -0.9 | 79.8 | 1.1 | |
| 84 | 49.4 | 0.8 | 75.0 | 0.5 | |
| 85 | 46.7 | -0.1 | 76.6 | 0.7 | |
| 86 | 52.7 | 1.9 | 72.6 | 0.2 | |
| 87 | 45.2 | -0.6 | 55.8 | -1.9 | |
| 88 | 48.8 | 0.6 | 79.0 | 1 | |
| 89 | 46.4 | -0.2 | 70.2 | -0.1 | |
| 90 | 49.7 | 0.9 | 82.2 | 1.4 |
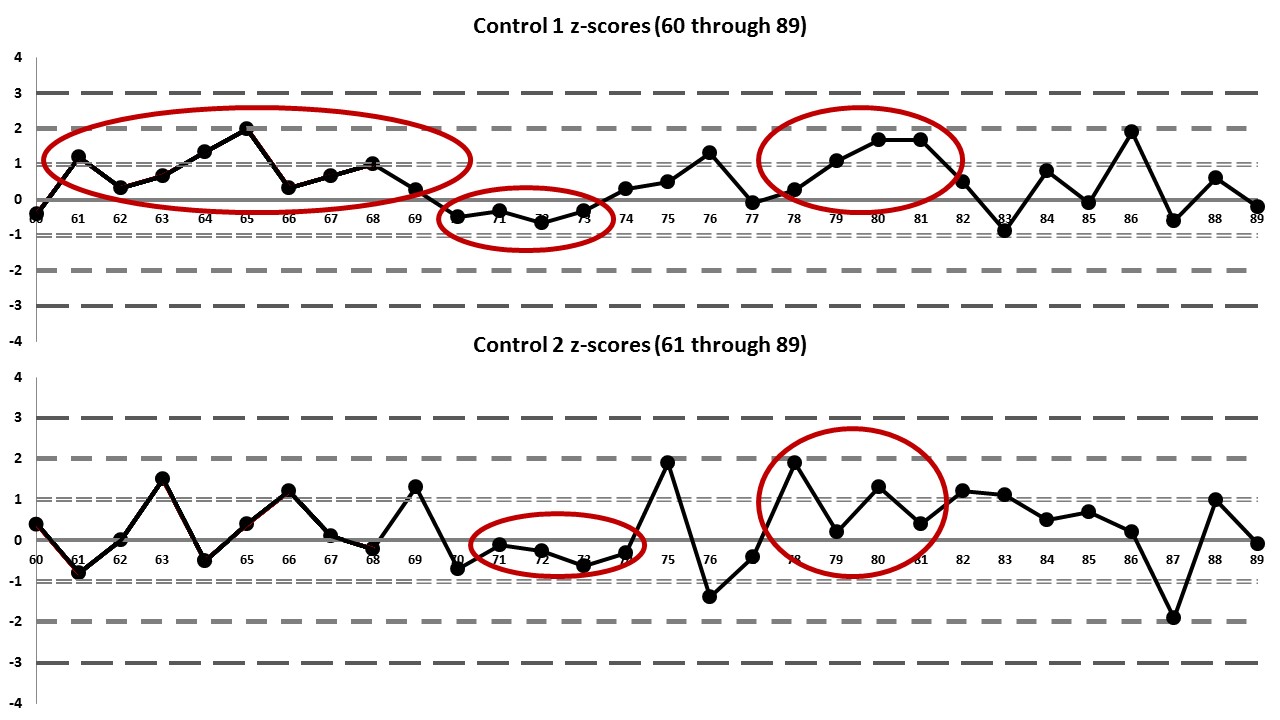
Finally, here is the third set of Levey-Jennings charts for the values 60 through 90:
Remember the caveats:
- We are running TWO controls per run; assume each pair of values represents one run
- We're NOT going to look for 2s violations. Let's break that habit right now. In any case, I didn't generate these data points randomly, so we should not expect to see a certain number "natural false rejections" in the form of 2s outliers
- We ARE going to try to find outliers of the following "Westgard Rules": 1:3s/2:2s/R:4s/4:1s/8:x
- We're NOT going to sink into the swamp that is the repeating of controls. So don't assume anything you see is a repeated control - just stick with "in" or "out"
So, at the end of this, can you answer the following questions?
- How many rule violations were there? 17 violations
- Which rules were violated and how many times?
- 1:3s (2 times)
- 2:2s (4 times)
- R:4s (3 times)
- 4:1s (4 times)
- 8:x violations (4 times)
- What would be different if I told you that only the "Westgard Rules" 1:3s/2:2s/R:4s were necessary?
- Ignore the 4:1s and 8:x violations because they aren't significant errors
- What would be different if I told you that only the 1:3s control rule was necessary?
- Only 3-4 violations
- What's the extra little error that exists in these charts and data points?
[Did you miss something? Do you still feel like you're missing something? Please don't feel afraid to ask for more explanations.]

About this website
WESTGARD QC promotes the latest news, education, and tools in the quality control field. Our goal is to bring tools, technology and training into today's healthcare industry — by featuring QC lessons, QC case studies and frequent essays from leaders in the quality control area. This is also a reference source for quality requirements, including CLIA requirements for analytical quality. This website features the best explanation of the Multirule ("Westgard Rules") and how to use them. For laboratory and healthcare professionals looking for educational and reference material in the quality control field.
THIS IS THE WEBSITE FOR YOU!