Resources
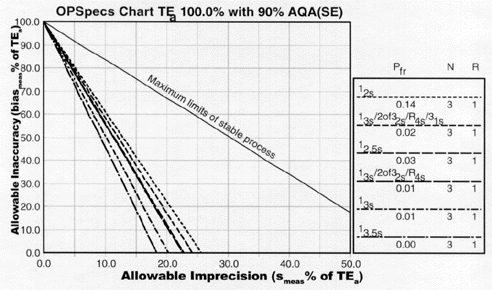
OPSpecs Chart N=3 90% AQA
A Normalized OPSpecs chart for QC procedures for Ns of 3, with 90% AQA.
Directions: Plot your normalized OPSpecs Chart operating point. If there are lines in the chart that lie above your operating point, they assure you the %AQA (error detection) listed in the title.

try the Normalized OPSpecs Chart for 90% error detection with N's of 6
