Quality Standards
New EFLM goals for hematology: fit for purpose?
A new study of biologic variation significantly reduce the desirable allowable imprecision and desirable allowable bias for hematology parameters. Using data from one of the latest generatation analyzers, the Sysmex XN, we try to see if the goals - or the instrument - are fit for purpose. What happens if we develop new goals that no one can achieve?
New EFLM goals for hematology: fit for purpose?
 Sten Westgard, MS
May 2018
- The Precision, Comparison and Sigma-metric data
- Summary of Performance according to new EFLM desirable specifications, as well as by Sigma-metrics Normalized Method Decision charts
- Conclusion
To understand the background of these new analytical performance specifications, you may want to read EuBIVAS: The New Era in Biologic Variation
[Note: This QC application is an extension of the lesson From Method Validation to Six Sigma: Translating Method Performance Claims into Sigma Metrics. This article assumes that you have read that lesson first, and that you are also familiar with the concepts of QC Design, Method Validation, and Six Sigma metrics. If you aren't, follow the link provided.]
The EFLM working group on biologic variation published a recent study on the biologic variation present in hematology parameters:: Within-subject and between-subject biological variation estimates of 21 hematological parameters in 30 healthy subjects. Clin Chem Lab Med. 2018 Apr 2. pii: /j/cclm.ahead-of-print/cclm-2017-1155/cclm-2017-1155.xml. doi: 10.1515/cclm-2017-1155. Coşkun A, Carobene A, Kilercik M, Serteser M, Sandberg S, Aarsand AK, Fernandez-Calle P, Jonker N, Bartlett WA, Díaz-Garzón J, Huet S, Kızıltaş C, Dalgakıran I, Ugur E, Unsal I; European Biological Variation Study of the EFLM Working Group on Biological Variation. Note that this paper only calculated desirable imprecision and desirable bias, but the Fraser approach details how to calculate desirable total allowable error from the data.
One way to evaluate the utility and fitness for purpose of these new performance specifications is to assess one of the latest hematology instruments:
Multicenter verification of the Sysmex XN-Series. Schoorl M, Schoorl M, Chevallier M, van der Ploeg T, van Pelt J. Int J Lab Hematol. 2017 Oct;39(5):489-496. doi: 10.1111/ijlh.12674. Epub 2017 May 18.
There are several possible outcomes when we evaluate the latest instrument performance data and the latest performance specifications:
- The latest instrument achieves the latest specifications: all are happy. (This hardly ever happens...)
- The latest instrument fails to achieve the latest specifications - and we blame the instrument as being unfit for purpose
- The latest instrument fails to achieve the latest specifications - and we blame the performance specifications as unrealistically small, impossible to achieve, and unfit for purpose
The Comparison of Imprecision and Bias and Sigma-metric Data
The details of the performance from the study are noted in a separate article. Our focus here is on comparing the imprecision and bias to the desirable imprecision and desirable bias, as detailed and calculated from the new EFLM study.
Three levels of performance were recorded. Bias was calculated using the regression equations from the comparison study.
| TEST | control level |
ELFM 2018 TEa |
% Bias | EFLM 2018 Desirable bias | CV | EFLM 2018 Desirable CV |
| WBC | 1.5 | 11.15 | 66.83 | Fails | 2.80 | Meets |
| des. bias = 4.59% | 8.5 | 11.15 | 14.68 |
Fails |
1.30 | Meets |
| des. CV = 3.98% | 60 | 11.15 | 5.08 | Fails | 0.80 | Meets |
| RBC | 1.6 | 3.84 | 52.35 | Fails | 0.80 | Meets |
| des. bias = 1.56% | 3.5 | 3.84 | 21.81 | Fails | 0.60 | Meets |
| des. CV = 1.38% | 5.5 | 3.84 | 12.46 | Fails | 0.50 | Meets |
| Hgb | 3.5 | 3.87 | 2.16 | Fails | 0.60 | Meets |
| des. bias = 1.61% | 8.5 | 3.87 | 0.11 | Meets | 0.60 | Meets |
| des. CV = 1.37% | 11 | 3.87 | 0.47 | Meets | 0.50 | Meets |
| Hematocrit | 0.2 | 3.86 | 2.00 | Fails | 0.70 | Meets |
| des. bias = 1.54% | 0.4 | 3.86 | 3.00 | Fails | 0.60 | Meets |
| des. CV = 1.41% | 0.55 | 3.86 | 3.27 | Fails | 0.50 | Meets |
| MCV | 65 | 1.6 | 3.32 | Fails | 0.70 | Fails |
| des. bias = 1.01% | 90 | 1.6 | 1.93 | Fails | 0.60 | Fails |
| des. CV = 0.36% | 120 | 1.6 | 1.02 | Fails | 0.50 | Fails |
| MCHC | 18 | 1.27 | 5.39 | Fails | 1.10 | Fails |
| des bias = 0.47% | 20 | 1.27 | 6.50 | Fails | 1.00 | Fails |
| des. CV = 0.49% | 23 | 1.27 | 7.80 | Fails | 0.80 | Fails |
| PLT-I | 100 | 8.51 | 0.11 | Meets | 3.90 | Fails |
| des. bias = 2.55% | 300 | 8.51 | 2.04 | Meets | 1.80 | Meets |
| des. CV = 3.61% | 1000 | 8.51 | 2.71 | Fails | 1.00 | Meets |
| Neutrophils | 0.5 | 14.65 | 21.30 | Fails | 5.20 | Meets |
| des bias = 5.08% | 5.5 | 14.65 | 5.30 | Fails | 1.70 | Meets |
| des CV= 5.8% | 25 | 14.65 | 4.05 | Meets | 1.40 | Meets |
| Lymphocytes | 1 | 17.6 | 38.00 | Fails | 4.00 | Meets |
| des bias = 5.65% | 3 | 17.6 | 10.67 | Fails | 3.30 | Meets |
| des. CV = 4.91% | 10 | 17.6 | 1.10 | Meets | 4.00 | Meets |
| Monocytes | 0.15 | 14.21 | 33.00 | Fails | 9.00 | Fails |
| des bias = 5.07% | 1.3 | 14.21 | 2.92 | Meets | 5.20 | Meets |
| des CV = 5.54% | 7 | 14.21 | 0.27 | Meets | 4.30 | Meets |
| Eosinophils | 0.1 | 26.15 | 5.80 | Meets | 17.70 | Fails |
| des. bias = 17.81% | 0.5 | 26.15 | 3.40 | Meets | 5.90 | Fails |
| des. CV = 5.06% | 1.5 | 26.15 | 3.00 | Meets | 5.50 | Fails |
| Basophils | 0.1 | 15.58 | 11.10 | Fails | 12.20 | Fails |
| des. bias = 6.21% | 0.5 | 15.58 | 23.10 | Fails | 7.60 | Fails |
| des. CV = 5.68% | 1.5 | 15.58 | 25.10 | Fails | 0.50 | Meets |
52.% of the observed imprecisions and biases measured do NOT meet the EFLM hematology performance specifications.
Of course, evaluating these components of error separately is easy - what's even more important is to consider what will happen when the imprecision and bias are combined. In a real-world lab testing, both types of errors are present in the single result. If half of our performance is unacceptable when we're not considering the combined effects, what's going to happen when we do assess the impact of both bias and CV?
We did that in the previous Sigma-metric assessment of this instrument, but with CLIA and older "Ricos goals". Now we're going to apply these new EFLM criteria, which are much more stringent.
Sigma-metric calculations using EFLM-derived allowable total errors
Remember the equation for Sigma metric is (TEa - bias) / CV:
For an 11.15% quality requirement, for WBC on the low level of the Sysmex XN, the equation is (11.15 - 66.83) / 2.8 = less than zero
For an 11.15% quality requirement, for WBC on the middle level of the Sysmex XN, the equation is (11.15 - 14.68) / 1.3 = less than zero
When the bias exceeds the allowable total error, there is simply no recovery. The method is generating a different result, aimed at a different target.
For an 11.15% quality requirement, for WBC on the middle level of the Sysmex XN, the equation is (11.15 - 14.68) / 1.3 = less than zero
The metrics are displayed along the right columns.
| TEST | control level | TEa | % Bias | CV | Sigma |
| WBC | 1.5 | 11.15 | 66.83 | 2.80 | negative |
| 8.5 | 11.15 | 14.68 | 1.30 | negative | |
| 60 | 11.15 | 5.08 | 0.80 | 7.59 | |
| RBC | 1.6 | 3.84 | 52.35 | 0.80 | negative |
| 3.5 | 3.84 | 21.81 | 0.60 | negative | |
| 5.5 | 3.84 | 12.46 | 0.50 | negative | |
| Hgb | 3.5 | 3,87 | 2.16 | 0.60 | 2.85 |
| 8.5 | 3,87 | 0.11 | 0.60 | 6.27 | |
| 11 | 3.87 | 0.47 | 0.50 | 6.80 | |
| Hematocrit | 0.2 | 3.86 | 2.00 | 0.70 | 2.66 |
| 0.4 | 3.86 | 3.00 | 0.60 | 1.43 | |
| 0.55 | 3.86 | 3.27 | 0.50 | 1.18 | |
| MCV | 65 | 1.6 | 3.32 | 0.70 | negative |
| 90 | 1.6 | 1.93 | 0.60 | negative | |
| 120 | 1.6 | 1.02 | 0.50 | 1.16 | |
| MCH | 1550 | 1.37 | 1.25 | 0.80 | 0.15 |
| 1950 | 1.37 | 1.32 | 1.00 | 0.05 | |
| 2400 | 1.37 | 1.38 | 0.80 | negative | |
| MCHC | 18 | 1.27 | 5.39 | 1.10 | negative |
| 20 | 1.27 | 6.50 | 1.00 | negative | |
| 23 | 1.27 | 7.80 | 0.80 | negative | |
| PLT-I | 100 | 8.51 | 0.11 | 3.90 | 2.15 |
| 300 | 8.51 | 2.04 | 1.80 | 3.59 | |
| 1000 | 8.51 | 2.71 | 1.00 | 5.8 | |
| Neutrophils | 0.5 | 14.65 | 21.30 | 5.20 | negative |
| 5.5 | 14.65 | 5.30 | 1.70 | 5.5 | |
| 25 | 14.65 | 4.05 | 1.40 | 7.57 | |
| Lymphocytes | 1 | 13.74 | 38.00 | 4.00 | negative |
| 3 | 13.74 | 10.67 | 3.30 | 0.93 | |
| 10 | 13.74 | 1.10 | 4.00 | 3.16 | |
| Monocytes | 0.15 | 14.21 | 33.00 | 9.00 | negative |
| 1.3 | 14.21 | 2.92 | 5.20 | 2.17 | |
| 7 | 14.21 | 0.27 | 4.30 | 3.24 | |
| Eosinophils | 0.1 | 26.15 | 5.80 | 17.70 | 1.15 |
| 0.5 | 26.15 | 3.40 | 5.90 | 3.86 | |
| 1.5 | 26.15 | 3.00 | 5.50 | 4.21 | |
| Basophils | 0.1 | 15.58 | 11.10 | 12.20 | 0.37 |
| 0.5 | 15.58 | 23.10 | 7.60 | negative | |
| 1.5 | 15.58 | 25.10 | 0.50 | negative |
Yes, there are more than a few negative Sigma-metrics. More than 70% of the performance of this instrument is below 3 Sigma, when benchmarked against Desirable allowable total error specifications derived from the new EFLM study. If we accept the goals as valid, the implications are severe for any laboratory implementing these methods. Full "Westgard Rules" will be mandatory on virtually all parameters, with QC needing to be run as frequently as one control per 10 patient specimens. It would be ruinously time-consuming and expensive to maintain a proper monitoring of this instrument with appropriate QC rules and controls.
But that assumes we accept these new desirable performance specifications as valid. Perhaps the goals, not the instrument, are unfit for purpose.
Summary of Performance by Sigma-metrics Method Decision Chart using EFLM derived TEa Goals
If the numbers aren't convincing enough, take a look at the plot of performance instead, using Normalized Sigma-metric Method Decision Charts:
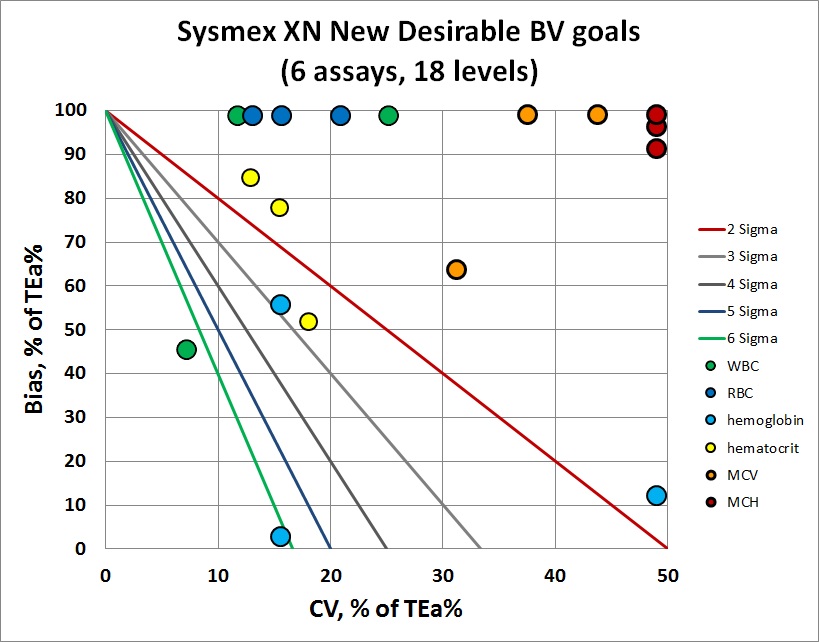
Overall, you can see that most of the y-coordinates (or imprecision) are stuck at the very top of the graph - the bias exceeds the allowable total error. But bias isn't the only problem - there are plenty of points that are toward the right side of the graph, indicating imprecision that is too large for the performance specification. There are very few points in the center of the bull's-eye here.
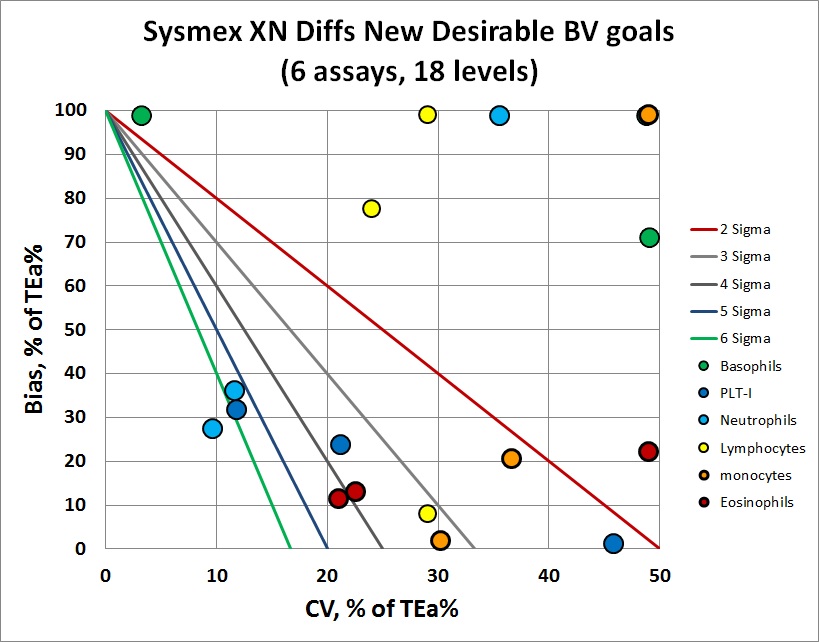
The differential counts are a bit better, with a few more points in the 4,5 and 6 Sigma zones. But there are still plenty of levels where bias and/or imprecision is excessive.
Normally, at this point, we would assess how much QC would be necessary to perform on these methods and instrument. But the performance, as benchmarked against the new EFLM study's calculated desirable allowable total errors, is just too poor. It would be utterly depressing to know how much QC was necessary - and it would not be practical for any lab to run that many controls so frequently with so many "Westgard Rules" applied.
Conclusion
As we mentioned earlier, the analysis of the instrument performance against the new EFLM biological variation-derived performance specifications create several possible answers:
- The instrument methods achieve the latest performance specifications: all are happy. (This was definitely NOT the case here...)
- The instrument methods fail to achieve the latest performanace specifications - and we blame the instrument as being unfit for purpose
- The instrument methods fail to achieve the latest performance specifications - and we blame the performance specifications as unrealistically small, impossible to achieve, and unfit for purpose
There is actually one further possible answer: BOTH the instrument methods and the performance specifications are unfit for purpose.
It's too early to tell what the conclusion should be, on the basis of just one set of data. Is the Sysmex XN, the latest generation of an extremely popular hematology instrument line, really unfit for purpose? We need several more sets of instrument performance data, at least one of them from the same instrument, and probably another set of data from a different instrument, before we can make a conclustion. With more data, we can triangulate which failures might be occurring.
- If all instruments fail to achieve these performance specifications, the performance goals are unrealistic for today's marketplace - they may be "correct" in a metrological sense, but they are not of any utility to the laboratory or clinician. Until the diagnostic industry and method engineering catches up with better methods, labs will need to choose different goals.
- If one or two instruments can achieve these performance specifications, then the goals are challenging but realistic, and they will help sort out the wheat from the chaff of the market. The instruments that fail to achieve these goals can be judged as "unfit for purpose."
- If all the instruments can easily achieve these performance specifications, we may want to consider using new optimal performance specifications, which are tighter than the desirable performance specifications. This is the happy ending we are all seeking, where both goals and instruments are fit for purpose.
If we were to make a guess, we might lean toward the conclusion that the new EFLM-derived allowable total error specifications are too challenging. This is a known problem, one that the Milan 2015 Consensus acknowledged - some methods will not be able to achieve goals from different models, such as Model 2 (biologically-driven goals). If we follow the Milan Consensus guidance, we may find that after all the effort to establish more data-driven biologically-based performance specifications, we can't use them, and we'll need to revert to "state of the art" goals instead.
Stay tuned, we'll be exploring these goals, and instrument performance, extensively in the coming months...